. 2010 Feb 10;5(2):e9150.
doi: 10.1371/journal.pone.0009150.

Histone H3 lysine 27 methylation asymmetry on developmentally-regulated promoters distinguish the first two lineages in mouse preimplantation embryos

Affiliations

Histone H3 lysine 27 methylation asymmetry on developmentally-regulated promoters distinguish the first two lineages in mouse preimplantation embryos

John Arne Dahl et al. PLoS One. .

Abstract

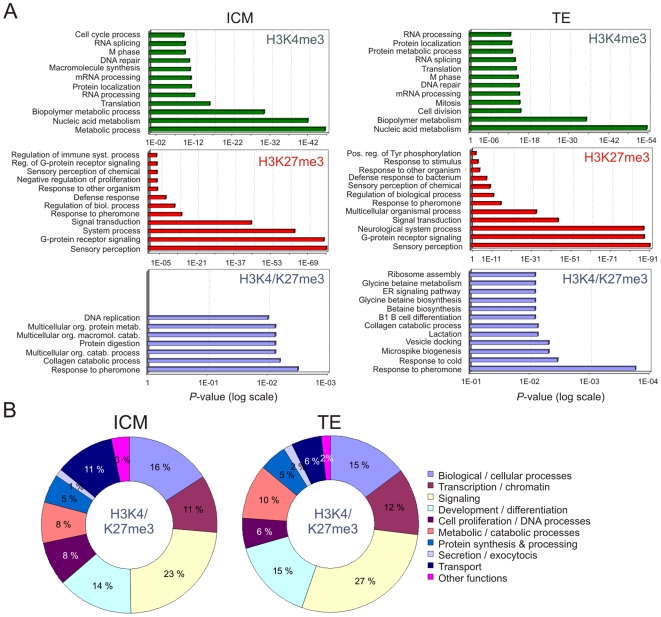
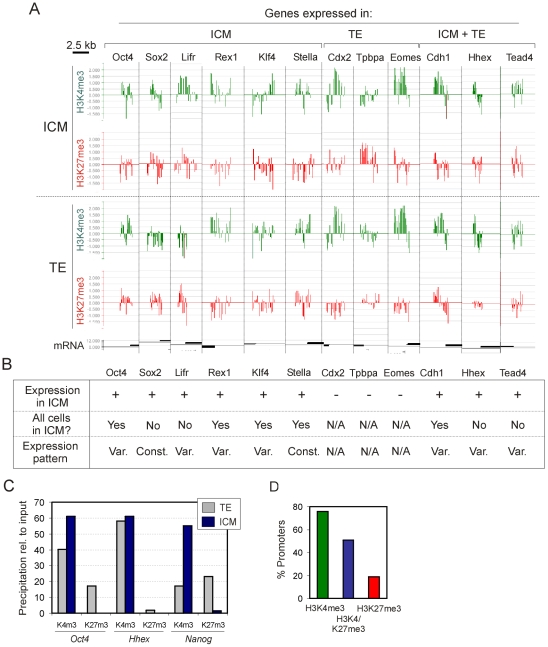
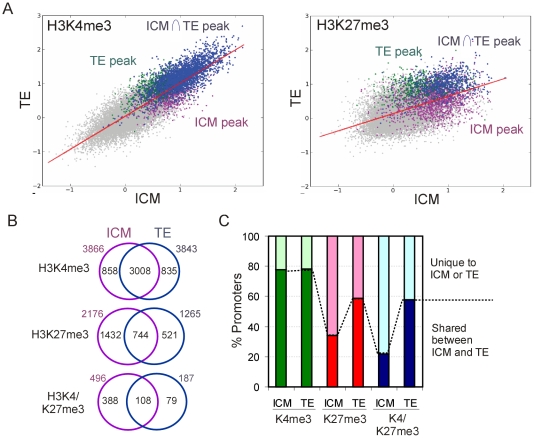
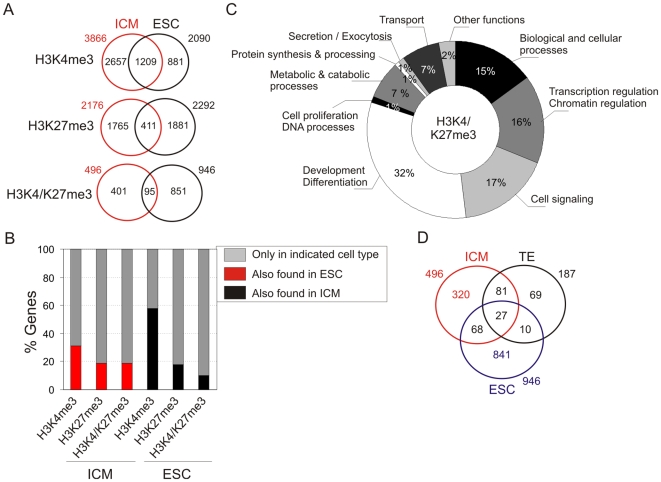
First lineage specification in the mammalian embryo leads to formation of the inner cell mass (ICM) and trophectoderm (TE), which respectively give rise to embryonic and extraembryonic tissues. We show here that this first differentiation event is accompanied by asymmetric distribution of trimethylated histone H3 lysine 27 (H3K27me3) on promoters of signaling and developmentally-regulated genes in the mouse ICM and TE. A genome-wide survey of promoter occupancy by H3K4me3 and H3K27me3 indicates that both compartments harbor promoters enriched in either modification, and promoters co-enriched in trimethylated H3K4 and H3K27 linked to developmental and signaling functions. The majority of H3K4/K27me3 co-enriched promoters are distinct between the two lineages, primarily due to differences in the distribution of H3K27me3. Derivation of embryonic stem cells leads to significant losses and gains of H3K4/K27me3 co-enriched promoters relative to the ICM, with distinct contributions of (de)methylation events on K4 and K27. Our results show histone trimethylation asymmetry on promoters in the first two developmental lineages, and highlight an epigenetic skewing associated with embryonic stem cell derivation.


Conflict of interest statement

Competing Interests: The authors have declared that no competing interests exist.

Figures

Figure 1
Figure 1. Distribution of H3K4me3, H3K27me3 and H3K4/K27me3 promoters in the ICM and TE.
(A) Isolation of ICMs (white arrow) and TEs (black arrow) from E4 blastocysts by microdissection (left panels), followed by immunosurgery of the ICM/TE halves to purify the ICM (large arrow). (B) 2-D scatter plots of averaged MaxTen values for H3K4me3 vs. H3K27me3 log2 signal intensities in the ICM (left) and TE (right). Data points were colored to indicate classification according to the peak calling algorithm to show H3K4me3-enriched promoters (green), H3K27me3-enriched promoters (red) and promoters co-enriched in H3K4me3 and H3K27me3 (blue). (C) H3K4me3 and H3K27me3 enrichment profiles on indicated promoters in the ICM and TE. Data are expressed as log2 ChIP/Input ratios. (D) Venn diagram analysis of H3K4me3 and H3K27me3 promoters in ICM and TE. (E) Average distribution of H3K4me3 and H3K27me3 on H3K4/K27me3, H3K4me3 and H3K27me3 promoters, relative to the position of the TSS (red bar).
Figure 2
Figure 2. Genes with promoters enriched in H3K4me3 and/or H3K27me3 are associated with distinct functional categories.
(A) GO term enrichment of genes containing H3K4me3, H3K27me3 or H3K4/K27me3 promoters in the ICM and TE. The twelve most significant GO terms are shown as a function of significance (P-value). (B) GO term representation of all genes containing H3K4/K27me3 promoters in the ICM and TE.
Figure 3
Figure 3. H3K4me3 and H3K27me3 enrichment profiles on genes expressed in the ICM and the TE.
(A) µChIP-chip data of H3K4me3 and H3K27me3 enrichment profiles on promoters of indicated genes in the ICM and TE (log2 ChIP/input ratios). (B) Expression scoring and pattern of each gene examined in (A) in the ICM (Var., variable expression level; Const., consistent expression pattern). Data were extracted from published Affymetrix data . (C) µChIP-qPCR analysis of H3K4me3 and H3K27me3 enrichment on the promoter of Oct4, Nanog and Hhex in the ICM and TE. (D) Percentage of expressed genes with promoters enriched in H3K4me3, H3K4/K27me3 or H3K27me3. Data were extracted from the Affymetrix dataset referred to in (B).
Figure 4
Figure 4. H3K27me3 is asymmetrically distributed in the ICM and TE.
(A) 2-D scatter plots of averaged MaxTen values for H3K4me3 and H3K27me3 log2 signal intensities in ICM vs. TE. Data points were colored to indicate classification according to the peak calling algorithm to show H3K4me3- or H3K27me3-enriched promoters in all ChIP replicates in the TE (green), the ICM (purple) and common to both lineages (blue). (B) Venn diagram analysis of H3K4me3, H3K27me3 and H3K4/K27me3 promoters in ICM and TE. (C) Percentages of H3K4me3, H3K27me3 and H3K4/K27me3 promoters shared between ICM and TE, or unique to either lineage.
Figure 5
Figure 5. Divergence of H3K4me3 and H3K27me3 enrichment profiles between ICM and ESCs.
(A) Venn diagram analysis of H3K4me3, H3K27me3 and H3K4/K27me3 promoters retaining and losing these marks after derivation of ESCs. (B) Percentages of promoters enriched in H3K4me3, H3K27me3 or both marks in the ICM and ESCs. (C) GO term representation of all H3K4/K27me3 genes identified in both the ICM and ESCs. (D) Venn diagram analysis of H3K4/K27me3 promoters in the ICM, TE and ESCs.

Similar articles

Cited by

References

    1. Rossant J, Tam PP. Blastocyst lineage formation, early embryonic asymmetries and axis patterning in the mouse. Development. 2009;136:701–713. - PubMed
    1. Ng RK, Dean W, Dawson C, Lucifero D, Madeja Z, et al. Epigenetic restriction of embryonic cell lineage fate by methylation of Elf5. Nat Cell Biol. 2008;10:1280–1290. - PMC - PubMed
    1. Albert M, Peters AH. Genetic and epigenetic control of early mouse development. Curr Opin Genet Dev. 2009;19:113–121. - PubMed
    1. Morgan HD, Santos F, Green K, Dean W, Reik W. Epigenetic reprogramming in mammals. Hum Mol Genet. 2005;14:R47–R58. - PubMed
    1. Erhardt S, Su IH, Schneider R, Barton S, Bannister AJ, et al. Consequences of the depletion of zygotic and embryonic enhancer of zeste 2 during preimplantation mouse development. Development. 2003;130:4235–4248. - PubMed

Publication types

MeSH terms

Associated data