. 2010 Feb 10;5(2):e9148.
doi: 10.1371/journal.pone.0009148.

The phosphate transporter PiT1 (Slc20a1) revealed as a new essential gene for mouse liver development

Affiliations

The phosphate transporter PiT1 (Slc20a1) revealed as a new essential gene for mouse liver development

Laurent Beck et al. PLoS One. .

Abstract

Background: PiT1 (or SLC20a1) encodes a widely expressed plasma membrane protein functioning as a high-affinity Na(+)-phosphate (Pi) cotransporter. As such, PiT1 is often considered as a ubiquitous supplier of Pi for cellular needs regardless of the lack of experimental data. Although the importance of PiT1 in mineralizing processes have been demonstrated in vitro in osteoblasts, chondrocytes and vascular smooth muscle cells, in vivo evidence is missing.

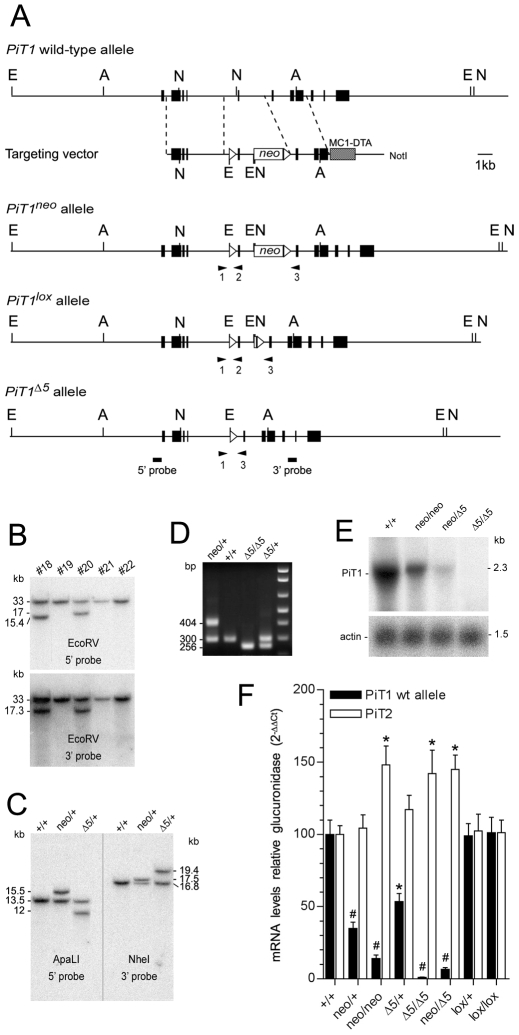
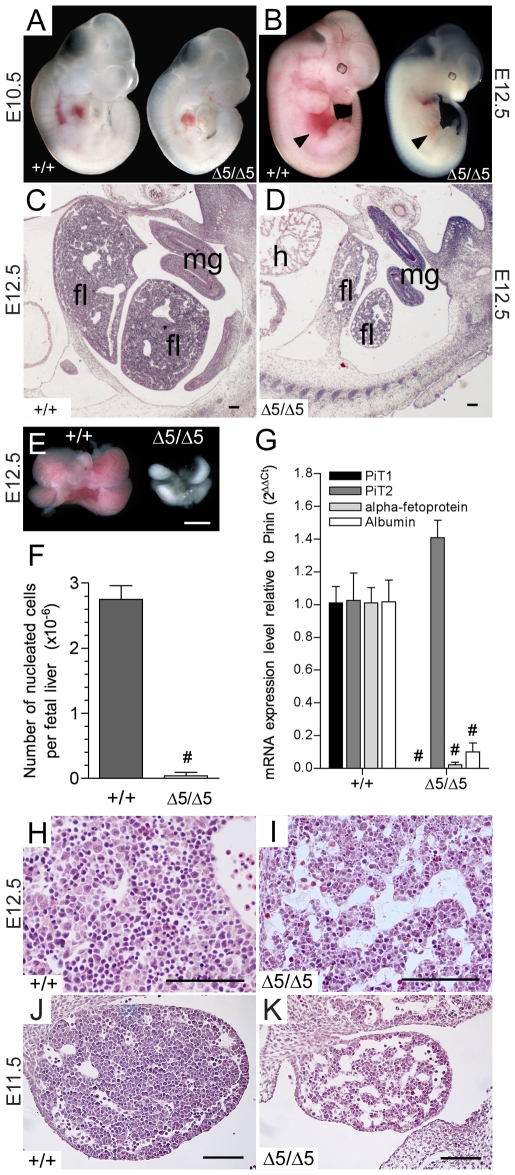
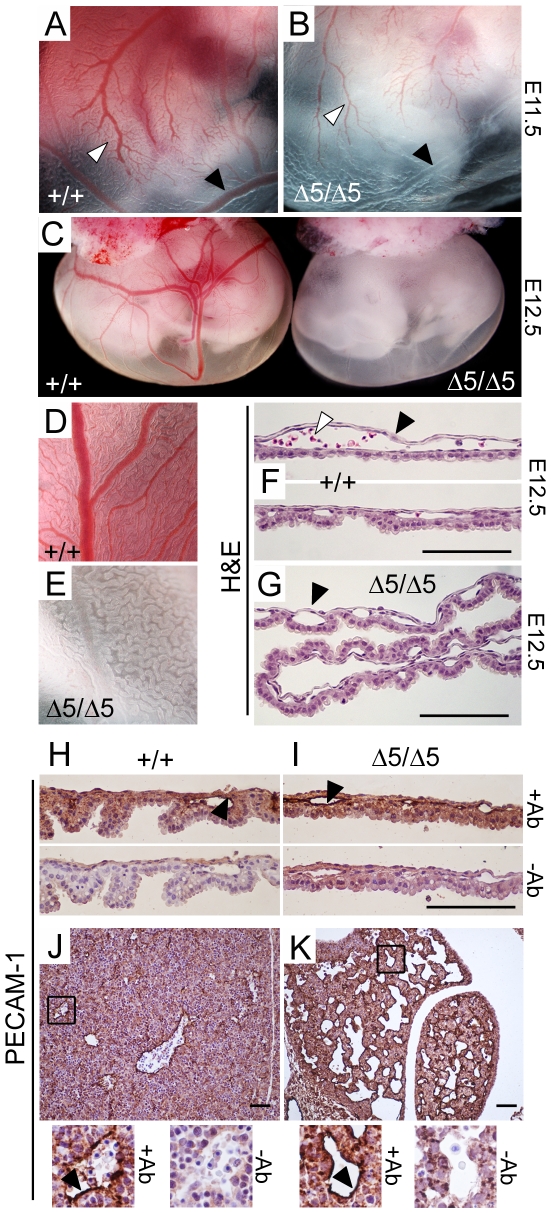
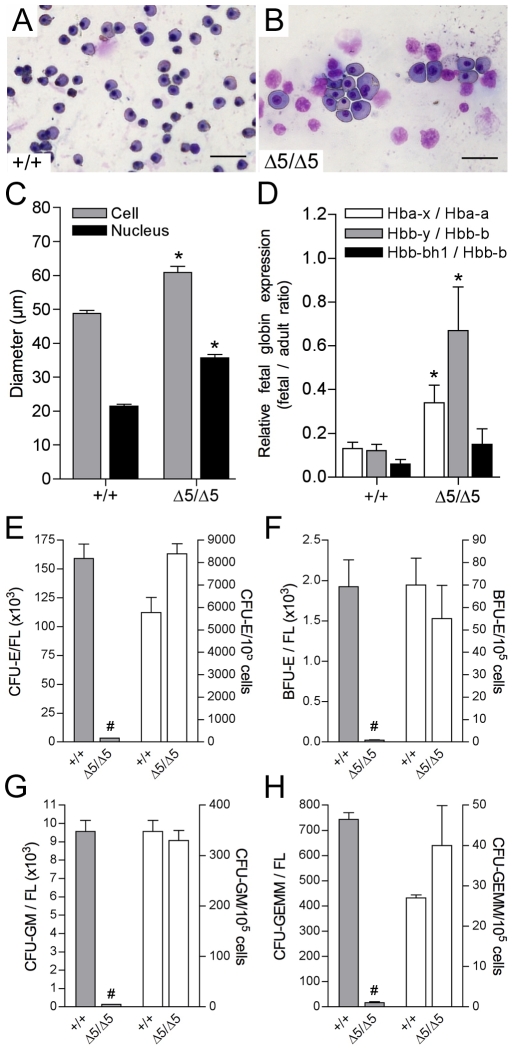
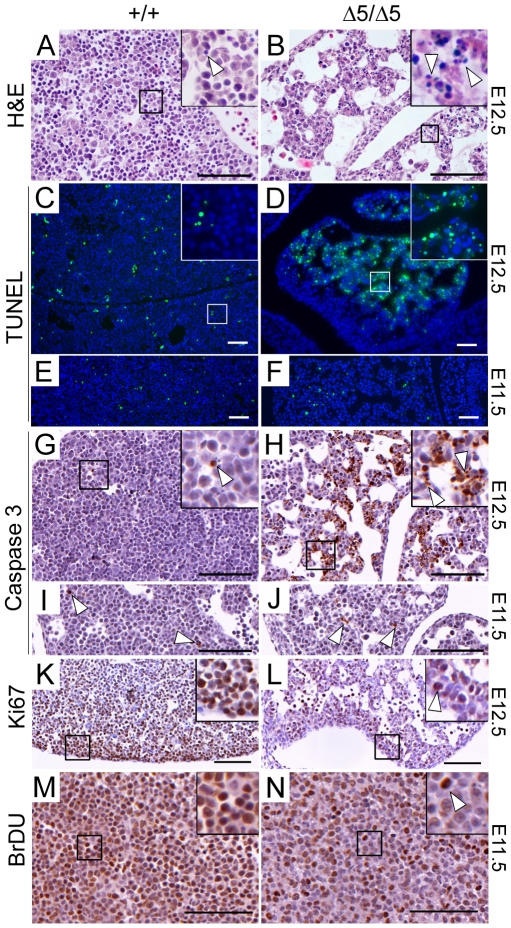
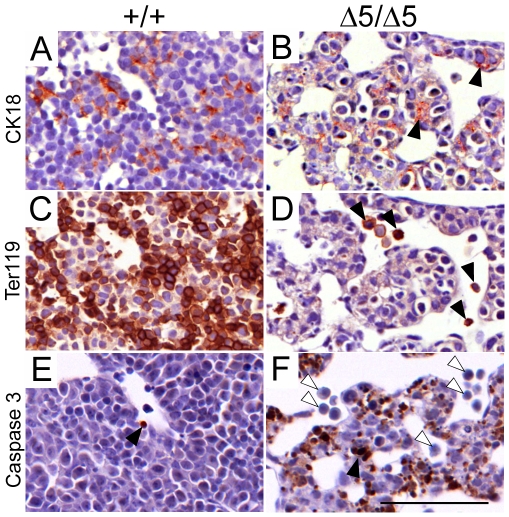
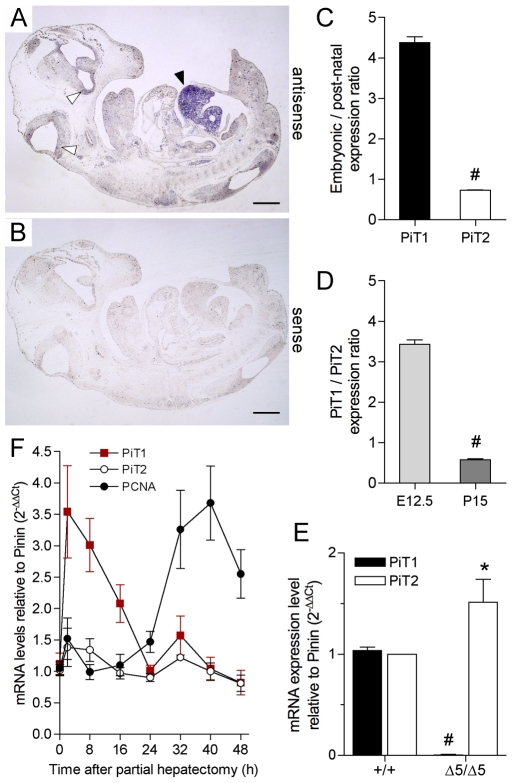
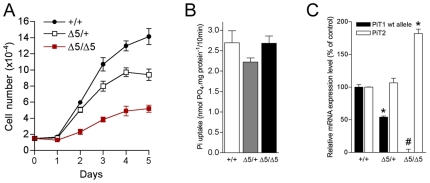
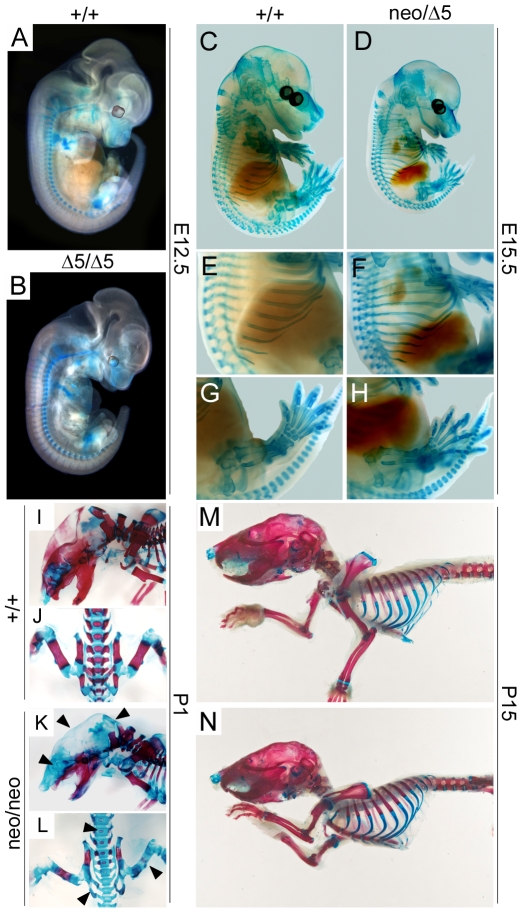
Methodology/principal findings: To determine the in vivo function of PiT1, we generated an allelic series of PiT1 mutations in mice by combination of wild-type, hypomorphic and null PiT1 alleles expressing from 100% to 0% of PiT1. In this report we show that complete deletion of PiT1 results in embryonic lethality at E12.5. PiT1-deficient embryos display severely hypoplastic fetal livers and subsequent reduced hematopoiesis resulting in embryonic death from anemia. We show that the anemia is not due to placental, yolk sac or vascular defects and that hematopoietic progenitors have no cell-autonomous defects in proliferation and differentiation. In contrast, mutant fetal livers display decreased proliferation and massive apoptosis. Animals carrying two copies of hypomorphic PiT1 alleles (resulting in 15% PiT1 expression comparing to wild-type animals) survive at birth but are growth-retarded and anemic. The combination of both hypomorphic and null alleles in heterozygous compounds results in late embryonic lethality (E14.5-E16.5) with phenotypic features intermediate between null and hypomorphic mice. In the three mouse lines generated we could not evidence defects in early skeleton formation.

Conclusion/significance: This work is the first to illustrate a specific in vivo role for PiT1 by uncovering it as being a critical gene for normal developmental liver growth.


Conflict of interest statement

Competing Interests: The authors have declared that no competing interests exist.

Figures

Figure 1
Figure 1. Generation of an allelic series of mutations at the PiT1 locus.
(A) Schematic representation of PiT1 alleles and targeting vector representing intronic DNA (horizontal lines), PiT1 exons (black boxes) a neo cassette flanked by frt sites (unfilled box) and a diphtheria toxin cassette (hatched box). Heterozygous PiT1neo/+ mice were produced as described. Flp-mediated recombination at frt sites generates the PiT1lox allele, whereas Cre-mediated recombination at loxP sites (open triangles) generates the PiT1 Δ5 allele. The positions of restriction sites used for Southern blot screening are shown: E, EcoRV; N, NheI; A, ApaLI. (B) Southern blot analysis of EcoRV-digested DNA from G418-resistant ES cell clones. The wild-type fragment is 33 kb in size, whereas correct recombination generates a 15.4 kb fragment using a 5′ probe and a 17.3 kb fragment using a 3′ probe (bar). A correctly targeted clone is represented (#18). (C) Genotype analysis of mice heterozygous for the various PiT1 alleles. Southern blots were performed on ApaLI or NheI-digested kidney DNA isolated from mice as indicated, using 5′ and 3′ probes. (D) PCR genotyping of mice from tail genomic DNA. Primer positions (triangles) are indicated in (A) and their sequences are reported in Table S1. (E) Northern blot of E12.5 whole embryo total RNA as indicated, probed with 32P-labeled PiT1 coding region cDNA. (F) Real-time RT-PCR analysis of the expression of the wild-type PiT1 and PiT2 alleles in E11.5 embryos from the PiT1 allelic mutant series, as indicated. Note that PiT2 is overexpressed in situation when the expression PiT1 becomes very low. * and # indicate significant differences as compared to wild-type controls with P<0.05 and P<0.001, respectively (Student's t test).
Figure 2
Figure 2. Disruption of the PiT1 gene leads to defective liver development and anemia.
(AB) Comparison between wild-type and PiT1 Δ5/Δ5 embryos at E10.5 (A) and E12.5 (B). Note the reduced size, pale appearance and small liver (black arrow) of the E12.5 mutant embryos. (C, D) Haematoxilin and eosin (H&E) staining of E12.5 sections from PiT1+/+ (C) and PiT1 Δ5/Δ5 embryos (D). fl: fetal liver; mg: mid-gut loop; h: heart. Bar, 100 µm. (E) Morphological appearance of wild-type and mutant E12.5 fetal livers. Bar, 0.5 mm (F) Fetal liver nucleated cell counts in E12.5 wild-type and mutant embryos. (G) Quantification of PiT1, PiT2, albumin and a-fetoprotein mRNA expression by real-time RT-PCR in E12.5 PiT1+/+ and PiT1 Δ5/Δ5 embryos. (HK) H&E staining of E12.5 (H,I) and E11.5 (J,K) sagital sections of PiT1+/+ and PiT1 Δ5/Δ5 livers illustrating the hypocellularity of the mutant livers. Bar, 100 µm. # indicate significant differences as compared to wild-type controls with P<0.001 (Student's t test).
Figure 3
Figure 3. Absence of major vascular defects in PiT1 Δ 5/Δ5 mice.
(AB) Yolk sac membranes from wild-type and PiT1Δ5/Δ5 E11.5 embryos illustrate the tree-like architecture of the vasculature (white arrow). Despite that mutant yolk sac appears white, vessels are present but often devoid of red blood cells (black arrow). (C) Gross appearance of wild-type (left) and PiT1Δ5/Δ5 (right) E12.5 embryos with intact yolk sac membranes. (DE) Close examination of wild-type and mutant yolk sac shows empty vessels in the mutant yolk sac (FG) H&E staining of yolk sac cross-sections from wild-type and PiT1 Δ5/Δ5 E12.5 embryos illustrate that, although null yolk sacs present with many vessels (black arrow), they are almost devoid of red blood cells (white arrow). (HI) Anti-PECAM-1 IHC (+Ab) of PiT1+/+ and PiT1 Δ5/Δ5 yolk sac cross-sections at E12.5 illustrating the presence of endothelial cells in both genotypes (black arrow). A negative control (−Ab) is shown to illustrate the specificity of the signal. (JK) Anti-PECAM-1 IHC (+Ab) of PiT1+/+ and PiT1 Δ5/Δ5 liver cross-sections at E12.5 illustrating the presence of endothelial cells in both genotypes. A negative control (−Ab) is shown to illustrate the specificity of the signal. Bar, 100 µm.
Figure 4
Figure 4. Elevated proportion of circulating primitive erythrocytes and identical number of hematopoietic progenitors per fetal liver in PiT1 Δ 5/Δ5 embryos.
(A, B) May-Grünwald/Giemsa staining of blood smears from E12.5 embryos. At E12.5 almost all blood cells are nucleated; enlarged cells represent primitive erythroid precursors. (C) Mean cell and nucleus diameter of erythroid cells in PiT1+/+ and PiT1 Δ5/Δ5 E12.5 embryos, measured with the NIS-Elements AR 3.00 software. (D) RT-PCR analysis of the expression of globin chains in E12.5 PiT1+/+ and PiT1 Δ5/Δ5 livers. Results are expressed as ratios between fetal and adult globin expression, as indicated. (EH) In vitro differentiation of E12.5 fetal-liver cells from wild-type and PiT1 Δ5/Δ5 embryos. The number of CFU-E (E), BFU-E (F), CFU-GM (G), and CFU-GEMM (H) colonies per fetal liver (FL) or per 105 nucleated fetal-liver cells are indicated. * and # indicate significant differences as compared to wild-type controls with P<0.05 and P<0.001, respectively (Student's t test).
Figure 5
Figure 5. Apoptotic and proliferation defect in PiT1-deficient fetal livers.
(AB) H&E staining of E12.5 livers illustrating the presence of large sinuses in mutants. Higher magnification views (boxes) illustrate the abundance of pyknotic nuclei (arrow) in the mutant liver. (CD) TUNEL analysis on sections from the same fetal livers shown in (AB). Note the significant number of positively stained cells (green) in the PiT1 Δ5/Δ5 livers. Nuclei were stained with DAPI (blue). (EF) TUNEL analysis on E11.5 fetal liver sections revealed that apoptotic signals were similar in wild-type and mutant livers. (GJ) Activated caspase 3 staining of E12.5 (G,H) and E11.5 (I,J), mutant liver sections. White arrows indicate examples of positively stained cells. (KL) Ki67 staining shows that while overall cell density is reduced, proliferation is reduced but ongoing in mutant embryos (arrow). (MN) Pulse BrDU labeling of E11.5 embryos. Positively labeled cells (arrow) are less numerous in the mutant. Bar, 100 µm.
Figure 6
Figure 6. Apoptotic defects in PiT1 mutant fetal liver cells.
(AB) Cytokeratin 18 (CK18) staining (brown) reveals the presence of hepatoblasts in E12.5 mutant sections (black arrows). (CD) Staining of Ter119 (brown) reveals great loss of erythroid cells in E12.5 mutant liver sections (black arrows). (EF) Activated caspase 3 staining of E12.5 liver sections reveals excessive apoptotic activity in mutant liver sections (black arrow) that was not present in Ter119 positive cells (white arrows). Bar, 100 µm.
Figure 7
Figure 7. PiT1 expression during liver growth.
(A) In situ hybridization (ISH) of a wild-type E12.5 embryo shows heavy PiT1 signal in the developing liver (black arrow), whereas low signal is detected in the brain (white arrows) and throughout the embryos. (B) ISH with the PiT1 sense probe gives no signal. Bar, 1 mm. (C) Ratios of PiT1 and PiT2 mRNA expression levels between embryonic (E12.5) and post-natal (P15) wild-type livers, as determined by real-time RT-PCR. (D) PiT1/PiT2 expression ratios in embryonic (E12.5) and post-natal (P15) livers, as determined by real-time RT-PCR. (E) Quantification of the expression of PiT1 and PiT2 in normal and PiT1 Δ5/Δ5 E12.5 livers by real-time RT-PCR. Note the 1.5-fold overexpression of PiT2 in PiT1-null livers. (F) Gene induction after partial hepatectomy. Total cellular RNA collected in a time course after partial hepatectomy in wild-type mice was analyzed by real time RT-PCR for the expression of PiT1, PiT2 and PCNA as a marker of proliferation. Results are reported after normalization to the expression of Pinin.
Figure 8
Figure 8. Disruption of PiT1 in MEFs does not affect Na+-Pi cotransport but leads to reduced proliferation.
(A) MEFs proliferation curve. PiT1 Δ5/Δ5 MEFs display a mean doubling time of 38 h, whereas PiT1+/+ and PiT1 Δ5/+ MEFs had a growth rate of 18 h and 20 h, respectively. (B) Na+-Pi uptake in MEFs. Disruption of PiT1 in MEFs does not modify the overall Pi uptake. (C) Quantification of the expression of PiT1 and PiT2 mRNAs in PiT1+/+ and PiT1 Δ5/Δ5 MEFs by real-time RT-PCR. Note the 1.8-fold overexpression of PiT2 mRNA in PiT1-null MEFs. * and # indicate significant differences as compared to wild-type controls with P<0.05 and P<0.001, respectively (Student's t test).
Figure 9
Figure 9. Impaired PiT1 expression in mice does not affect early skeleton development.
(AB) Alcian blue staining of PiT1+/+ and PiT1 Δ5/Δ5 E12.5 whole embryos. (CH) Alcian blue staining of PiT1+/+ and PiT1neo/ Δ5 E15.5 whole embryos. Higher magnification views (EH) demonstrate no difference in skeletal development of the heterozygous compounds. (IL) Alcian blue and alizarin red S double staining of one-day old PiT1+/+ and PiT1neo/neo newborn pups. Note the lack of alizarin red staining in humerus, verterbraes, cranial vault and upper facial skeleton (black arrows). (MN) Alcian blue and alizarin red S double staining of 15-day old PiT1+/+ and PiT1neo/neo mice. No staining difference could be evidenced anymore.

References

    1. O'Hara B, Johann SV, Klinger HP, Blair DG, Rubinson H, et al. Characterization of a human gene conferring sensitivity to infection by gibbon ape leukemia virus. Cell Growth Differ. 1990;1:119–127. - PubMed
    1. Kavanaugh MP, Miller DG, Zhang W, Law W, Kozak SL, et al. Cell-surface receptors for gibbon ape leukemia virus and amphotropic murine retrovirus are inducible sodium-dependent phosphate symporters. Proc Natl Acad Sci U S A. 1994;91:7071–7075. - PMC - PubMed
    1. Olah Z, Lehel C, Anderson WB, Eiden MV, Wilson CA. The cellular receptor for gibbon ape leukemia virus is a novel high affinity sodium-dependent phosphate transporter. J Biol Chem. 1994;269:25426–25431. - PubMed
    1. Miller DG, Miller AD. A family of retroviruses that utilize related phosphate transporters for cell entry. J Virol. 1994;68:8270–8276. - PMC - PubMed
    1. Saier MH., Jr A functional-phylogenetic classification system for transmembrane solute transporters. Microbiol Mol Biol Rev. 2000;64:354–411. - PMC - PubMed

Publication types

MeSH terms

Substances