

Transcriptome profiles of carcinoma-in-situ and invasive non-small cell lung cancer as revealed by SAGE
- PMID: 20161782
- PMCID: PMC2820080
- DOI: 10.1371/journal.pone.0009162
Transcriptome profiles of carcinoma-in-situ and invasive non-small cell lung cancer as revealed by SAGE
Abstract
Background: Non-small cell lung cancer (NSCLC) presents as a progressive disease spanning precancerous, preinvasive, locally invasive, and metastatic lesions. Identification of biological pathways reflective of these progressive stages, and aberrantly expressed genes associated with these pathways, would conceivably enhance therapeutic approaches to this devastating disease.
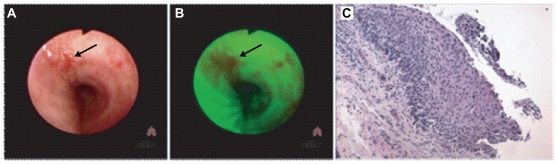
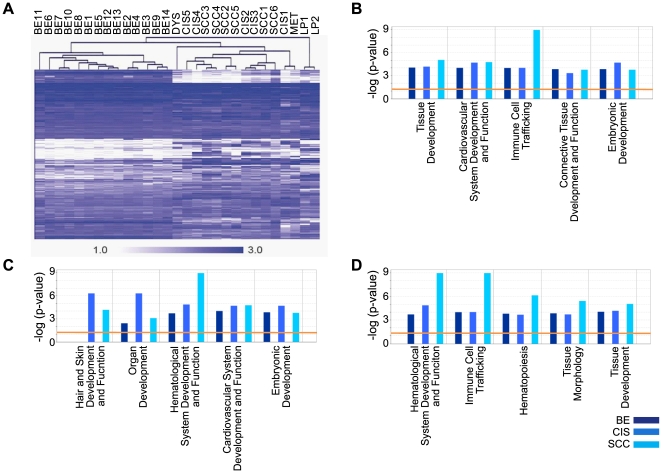
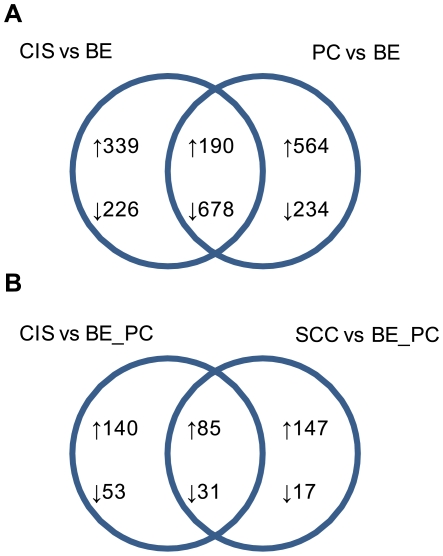
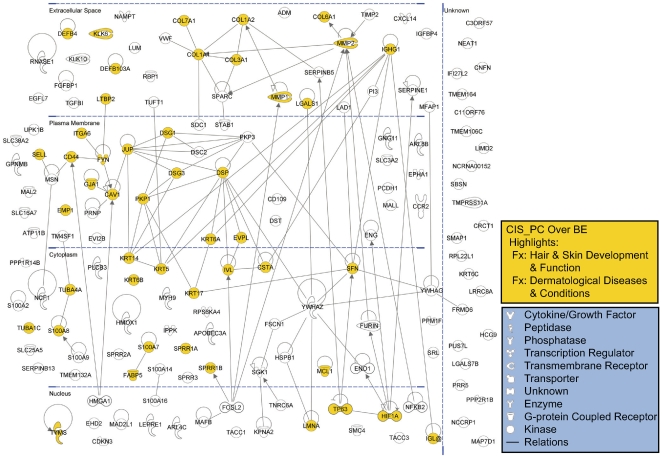
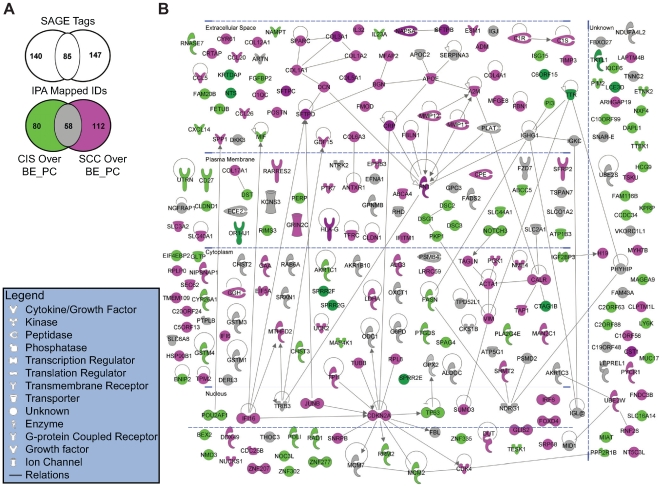
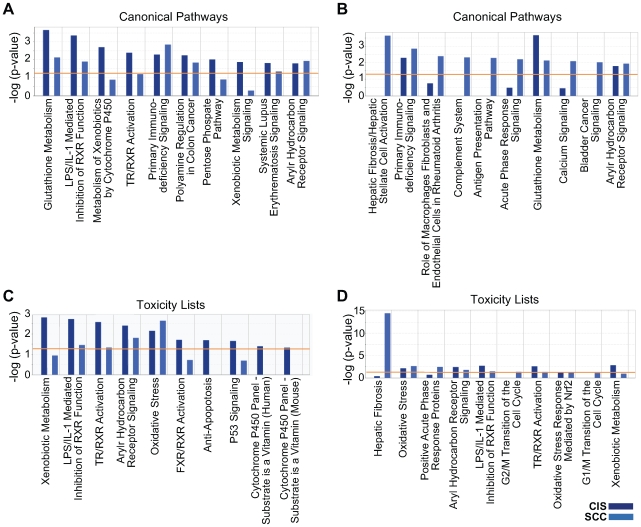
Methodology/principal findings: Through the construction and analysis of SAGE libraries, we have determined transcriptome profiles for preinvasive carcinoma-in-situ (CIS) and invasive squamous cell carcinoma (SCC) of the lung, and compared these with expression profiles generated from both bronchial epithelium, and precancerous metaplastic and dysplastic lesions using Ingenuity Pathway Analysis. Expression of genes associated with epidermal development, and loss of expression of genes associated with mucociliary biology, are predominant features of CIS, largely shared with precancerous lesions. Additionally, expression of genes associated with xenobiotic metabolism/detoxification is a notable feature of CIS, and is largely maintained in invasive cancer. Genes related to tissue fibrosis and acute phase immune response are characteristic of the invasive SCC phenotype. Moreover, the data presented here suggests that tissue remodeling/fibrosis is initiated at the early stages of CIS. Additionally, this study indicates that alteration in copy-number status represents a plausible mechanism for differential gene expression in CIS and invasive SCC.
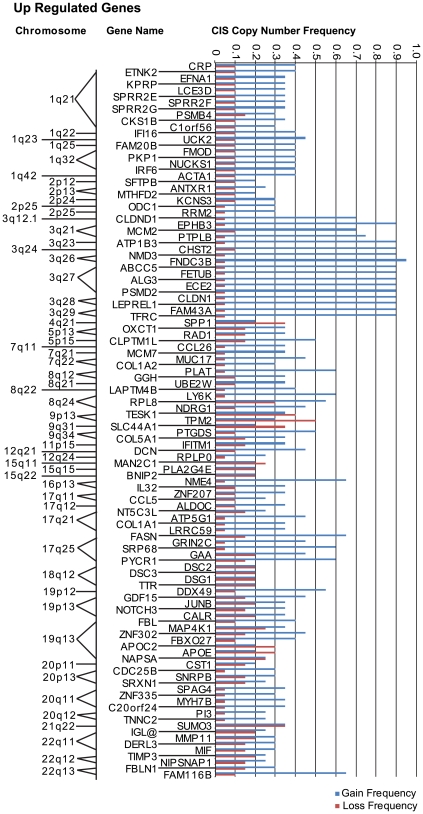
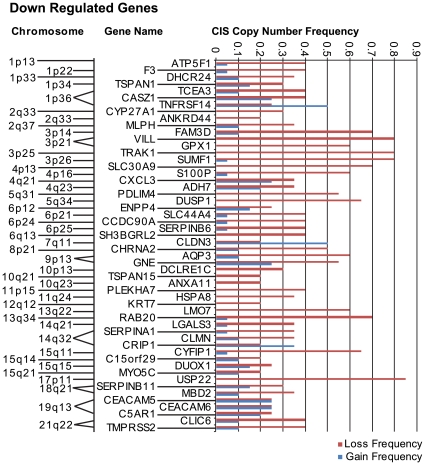
Conclusions/significance: This study is the first report of large-scale expression profiling of CIS of the lung. Unbiased expression profiling of these preinvasive and invasive lesions provides a platform for further investigations into the molecular genetic events relevant to early stages of squamous NSCLC development. Additionally, up-regulated genes detected at extreme differences between CIS and invasive cancer may have potential to serve as biomarkers for early detection.
Conflict of interest statement
Figures
Similar articles
-
Interrogating the precancerous evolution of pathway dysfunction in lung squamous cell carcinoma using XTABLE.Elife. 2023 Mar 9;12:e77507. doi: 10.7554/eLife.77507. Elife. 2023. PMID: 36892933 Free PMC article.
-
Smoking and cancer-related gene expression in bronchial epithelium and non-small-cell lung cancers.J Pathol. 2006 Oct;210(2):192-204. doi: 10.1002/path.2039. J Pathol. 2006. PMID: 16915569
-
Sex determining region Y-Box 2 (SOX2) is a potential cell-lineage gene highly expressed in the pathogenesis of squamous cell carcinomas of the lung.PLoS One. 2010 Feb 9;5(2):e9112. doi: 10.1371/journal.pone.0009112. PLoS One. 2010. PMID: 20161759 Free PMC article.
-
Natural history of bronchial preinvasive lesions.Cancer Metastasis Rev. 2010 Mar;29(1):5-14. doi: 10.1007/s10555-010-9214-7. Cancer Metastasis Rev. 2010. PMID: 20112052 Free PMC article. Review.
-
Pulmonary preinvasive neoplasia.J Clin Pathol. 2001 Apr;54(4):257-71. doi: 10.1136/jcp.54.4.257. J Clin Pathol. 2001. PMID: 11304841 Free PMC article. Review.
Cited by
-
Immunoglobulin G expression in lung cancer and its effects on metastasis.PLoS One. 2014 May 22;9(5):e97359. doi: 10.1371/journal.pone.0097359. eCollection 2014. PLoS One. 2014. Retraction in: PLoS One. 2020 Jan 24;15(1):e0228444. doi: 10.1371/journal.pone.0228444. PMID: 24853685 Free PMC article. Retracted.
-
Lung cancer transcriptomes refined with laser capture microdissection.Am J Pathol. 2014 Nov;184(11):2868-84. doi: 10.1016/j.ajpath.2014.06.028. Epub 2014 Aug 14. Am J Pathol. 2014. PMID: 25128906 Free PMC article.
-
Extracellular matrix profiles determine risk and prognosis of the squamous cell carcinoma subtype of non-small cell lung carcinoma.Genome Med. 2022 Nov 21;14(1):126. doi: 10.1186/s13073-022-01127-6. Genome Med. 2022. PMID: 36404344 Free PMC article.
-
A sequence-based approach to identify reference genes for gene expression analysis.BMC Med Genomics. 2010 Aug 3;3:32. doi: 10.1186/1755-8794-3-32. BMC Med Genomics. 2010. PMID: 20682026 Free PMC article.
-
Whole Transcriptome Analysis of Pre-invasive and Invasive Early Squamous Lung Carcinoma in Archival Laser Microdissected Samples.Respir Res. 2017 Jan 10;18(1):12. doi: 10.1186/s12931-016-0496-3. Respir Res. 2017. PMID: 28073359 Free PMC article.
References
-
- Jemal A, Siegel R, Ward E, Hao Y, Xu J, et al. Cancer statistics, 2009. CA Cancer J Clin. 2009;59:225–249. - PubMed
-
- Auberger J, Loeffler-Ragg J, Wurzer W, Hilbe W. Targeted therapies in non-small cell lung cancer: proven concepts and unfulfilled promises. Curr Cancer Drug Targets. 2006;6:271–294. - PubMed
-
- Di Maio M, Gridelli C, Normanno N, Perrone F, Ciardiello F. Trying to compose the puzzle with all the pieces: epidermal growth factor receptor tyrosine kinase inhibitors in non-small cell lung cancer. J Cell Physiol. 2005;205:355–363. - PubMed
-
- Isobe T, Herbst RS, Onn A. Current management of advanced non-small cell lung cancer: targeted therapy. Semin Oncol. 2005;32:315–328. - PubMed
-
- Janne PA, Johnson BE. Effect of epidermal growth factor receptor tyrosine kinase domain mutations on the outcome of patients with non-small cell lung cancer treated with epidermal growth factor receptor tyrosine kinase inhibitors. Clin Cancer Res. 2006;12:4416s–4420s. - PubMed
Publication types
MeSH terms
Grants and funding
LinkOut - more resources
Full Text Sources
Other Literature Sources
Medical
Molecular Biology Databases
Research Materials
