

Plasma protein biomarkers for depression and schizophrenia by multi analyte profiling of case-control collections
- PMID: 20161799
- PMCID: PMC2820097
- DOI: 10.1371/journal.pone.0009166
Plasma protein biomarkers for depression and schizophrenia by multi analyte profiling of case-control collections
Abstract
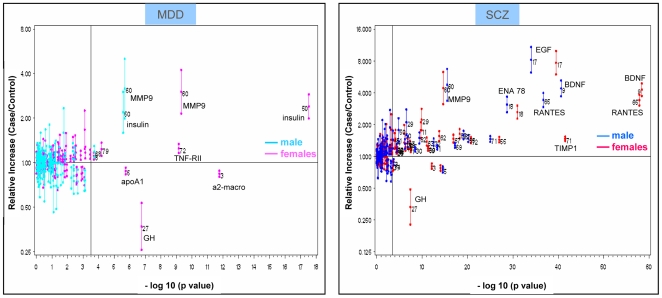
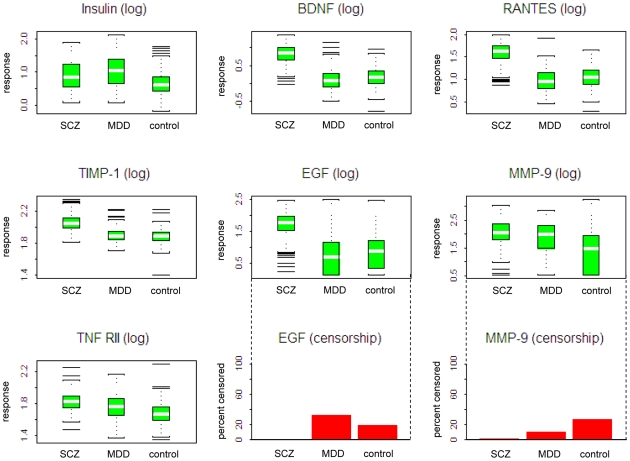
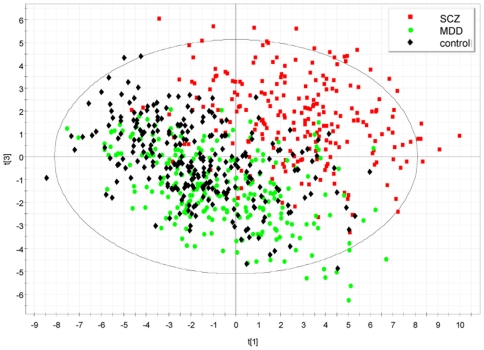
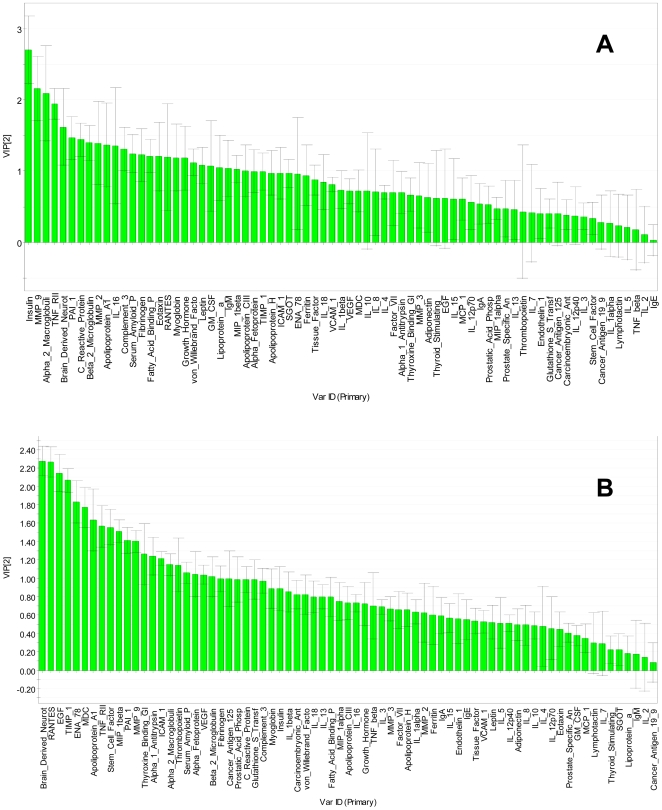
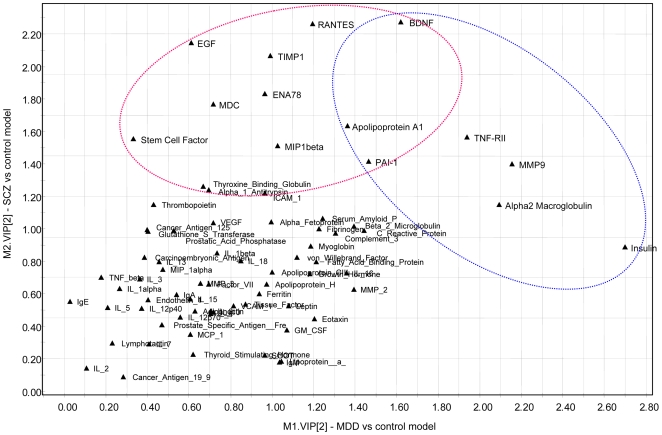
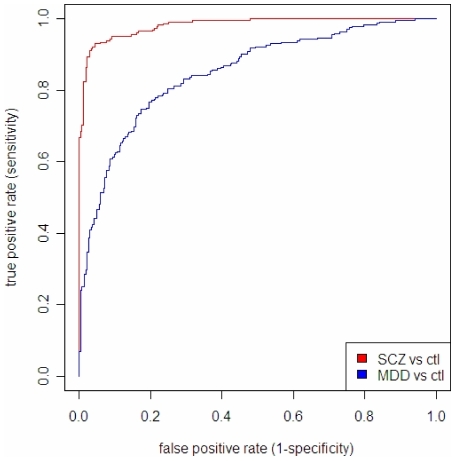
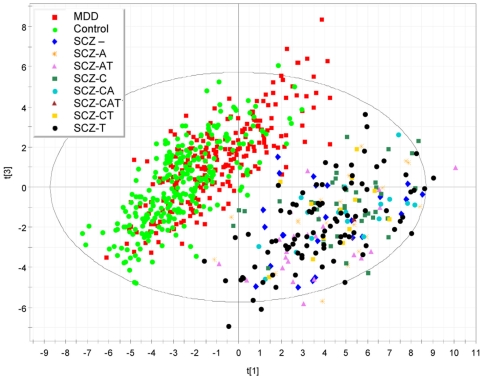
Despite significant research efforts aimed at understanding the neurobiological underpinnings of psychiatric disorders, the diagnosis and the evaluation of treatment of these disorders are still based solely on relatively subjective assessment of symptoms. Therefore, biological markers which could improve the current classification of psychiatry disorders, and in perspective stratify patients on a biological basis into more homogeneous clinically distinct subgroups, are highly needed. In order to identify novel candidate biological markers for major depression and schizophrenia, we have applied a focused proteomic approach using plasma samples from a large case-control collection. Patients were diagnosed according to DSM criteria using structured interviews and a number of additional clinical variables and demographic information were assessed. Plasma samples from 245 depressed patients, 229 schizophrenic patients and 254 controls were submitted to multi analyte profiling allowing the evaluation of up to 79 proteins, including a series of cytokines, chemokines and neurotrophins previously suggested to be involved in the pathophysiology of depression and schizophrenia. Univariate data analysis showed more significant p-values than would be expected by chance and highlighted several proteins belonging to pathways or mechanisms previously suspected to be involved in the pathophysiology of major depression or schizophrenia, such as insulin and MMP-9 for depression, and BDNF, EGF and a number of chemokines for schizophrenia. Multivariate analysis was carried out to improve the differentiation of cases from controls and identify the most informative panel of markers. The results illustrate the potential of plasma biomarker profiling for psychiatric disorders, when conducted in large collections. The study highlighted a set of analytes as candidate biomarker signatures for depression and schizophrenia, warranting further investigation in independent collections.
Conflict of interest statement
Figures
Similar articles
-
Genetic biomarkers of depression.Indian J Hum Genet. 2012 Jan;18(1):20-33. doi: 10.4103/0971-6866.96639. Indian J Hum Genet. 2012. PMID: 22754217 Free PMC article.
-
Can BDNF and IL-2 be indicators for the diagnosis in schizophrenic patients with depressive symptoms?Acta Neuropsychiatr. 2014 Oct;26(5):291-7. doi: 10.1017/neu.2014.13. Acta Neuropsychiatr. 2014. PMID: 25241757
-
Letter to the Editor: CONVERGENCES AND DIVERGENCES IN THE ICD-11 VS. DSM-5 CLASSIFICATION OF MOOD DISORDERS.Turk Psikiyatri Derg. 2021;32(4):293-295. doi: 10.5080/u26899. Turk Psikiyatri Derg. 2021. PMID: 34964106 English, Turkish.
-
Brain-derived neurotrophic factor (BDNF) and inflammatory markers: Perspectives for the management of depression.Prog Neuropsychopharmacol Biol Psychiatry. 2021 Jun 8;108:110151. doi: 10.1016/j.pnpbp.2020.110151. Epub 2020 Oct 21. Prog Neuropsychopharmacol Biol Psychiatry. 2021. PMID: 33096156 Review.
-
[Use of antidepressant drugs in schizophrenic patients with depression].Encephale. 2006 Mar-Apr;32(2 Pt 1):263-9. doi: 10.1016/s0013-7006(06)76153-x. Encephale. 2006. PMID: 16910628 Review. French.
Cited by
-
Proteomic insights into mental health status: plasma markers in young adults.Transl Psychiatry. 2024 Jan 24;14(1):55. doi: 10.1038/s41398-024-02751-z. Transl Psychiatry. 2024. PMID: 38267423 Free PMC article.
-
Multidimensional mapping method using an arrayed sensing system for cross-reactivity screening.PLoS One. 2015 Mar 19;10(3):e0116310. doi: 10.1371/journal.pone.0116310. eCollection 2015. PLoS One. 2015. PMID: 25789880 Free PMC article.
-
Functional biomarkers of depression: diagnosis, treatment, and pathophysiology.Neuropsychopharmacology. 2011 Nov;36(12):2375-94. doi: 10.1038/npp.2011.151. Epub 2011 Aug 3. Neuropsychopharmacology. 2011. PMID: 21814182 Free PMC article. Review.
-
Elevated Epidermal Growth Factor (EGF) as Candidate Biomarker of Mood Disorders-Longitudinal Study in Adolescent and Young Adult Patients.J Clin Med. 2021 Sep 8;10(18):4064. doi: 10.3390/jcm10184064. J Clin Med. 2021. PMID: 34575175 Free PMC article.
-
Telomere Length and CCL11 Levels are Associated With Gray Matter Volume and Episodic Memory Performance in Schizophrenia: Evidence of Pathological Accelerated Aging.Schizophr Bull. 2018 Jan 13;44(1):158-167. doi: 10.1093/schbul/sbx015. Schizophr Bull. 2018. PMID: 28338779 Free PMC article.
References
-
- Connor TJ, Leonard BE. Preskorn SH, Feighner JP, Stanga C, Ross R, editors. Biological markers for Depression. 2004. pp. 117–148. Handbook of Experimental Pharmacology. Antidepressants. Past, Present and Future (Volume 157). Springer, New York.
-
- Domenici E, Muglia P. The search for peripheral markers in psychiatry by genomic and proteomic approaches. Exp Opin Med Diagn. 2007;1:235–251. - PubMed
-
- Ising M, Horstmann S, Kloiber S, Lucae S, Binder EB, et al. Combined Dexamethasone/Corticotropin Releasing Hormone Test Predicts Treatment Response in Major Depression-A potential Biomarker? Biol Psychiatry. 2007;62:47–54. - PubMed
Publication types
MeSH terms
Substances
Grants and funding
LinkOut - more resources
Full Text Sources
Other Literature Sources
Medical
Miscellaneous
