. 2010 Dec 1;127(11):2530-41.
doi: 10.1002/ijc.25254.

Cleavage of galectin-3 by matrix metalloproteases induces angiogenesis in breast cancer

Affiliations

Cleavage of galectin-3 by matrix metalloproteases induces angiogenesis in breast cancer

Pratima Nangia-Makker et al. Int J Cancer. .

Abstract

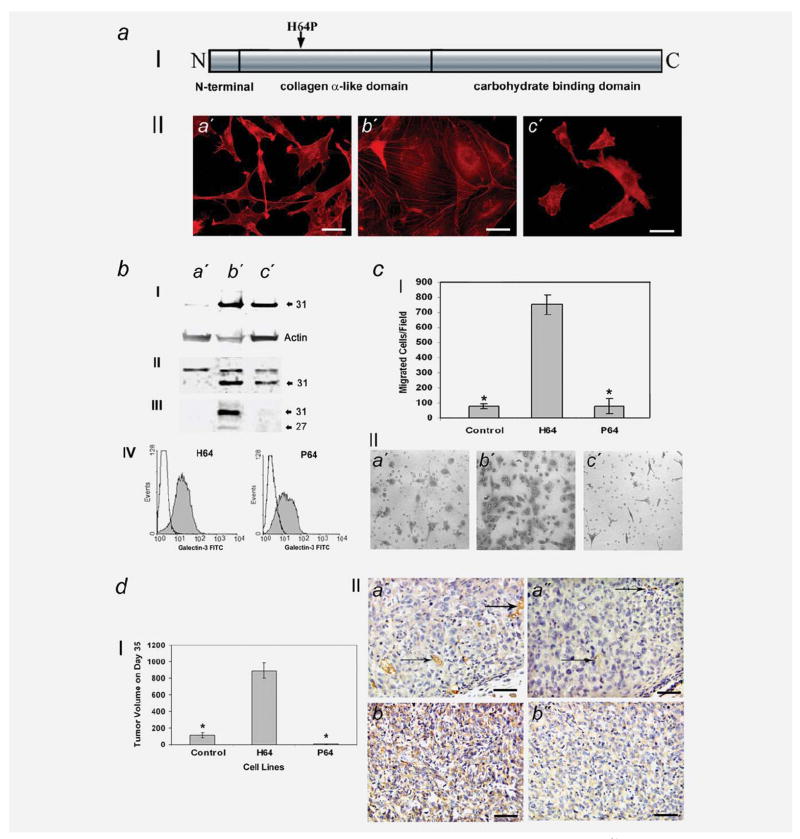
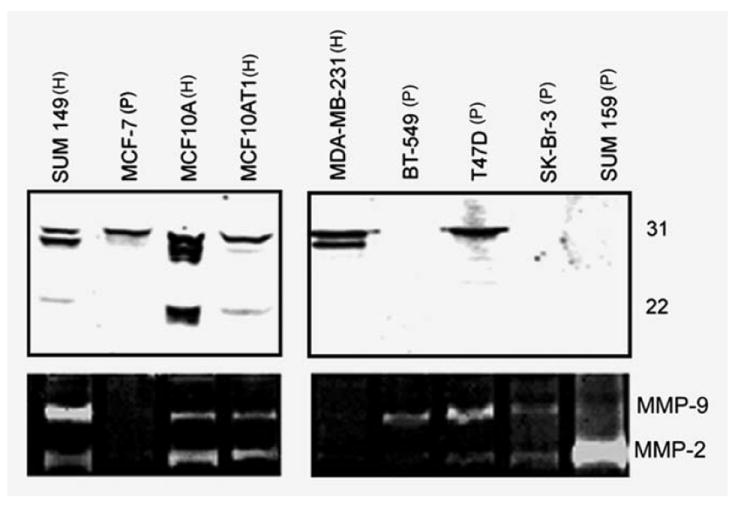
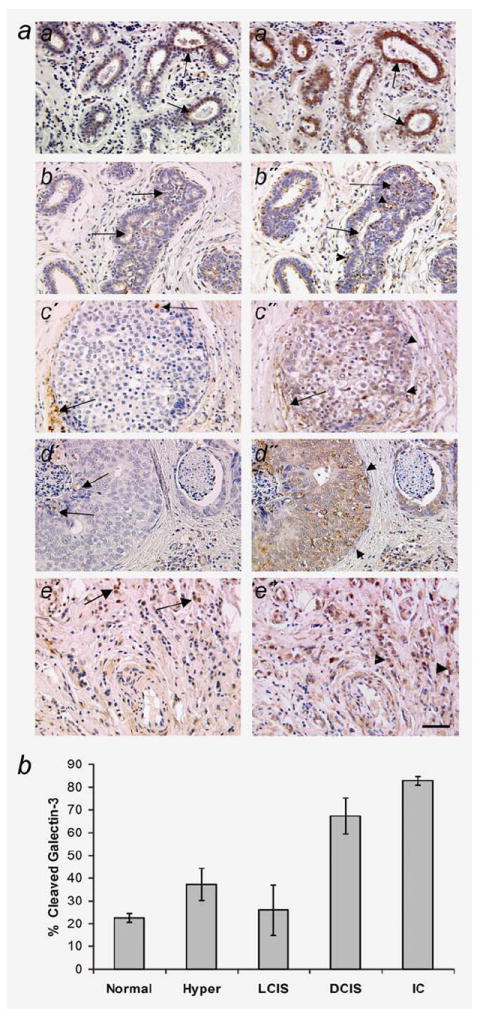
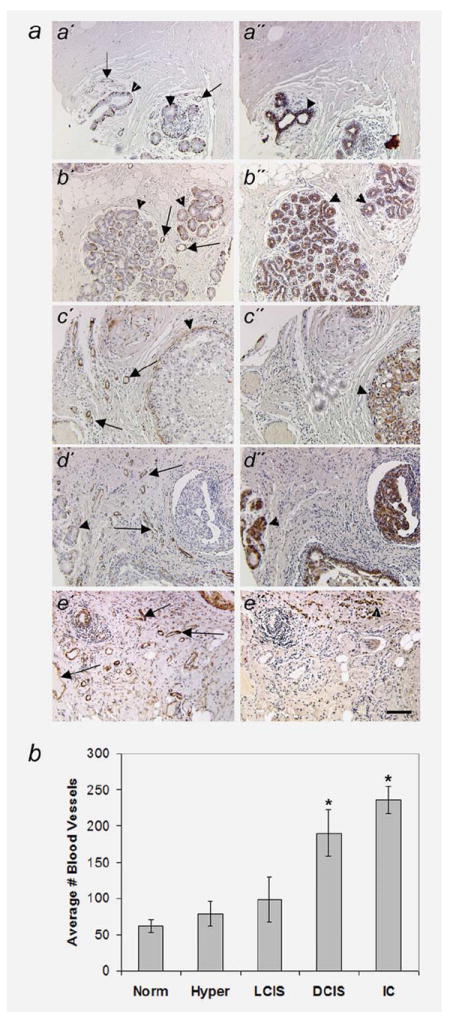
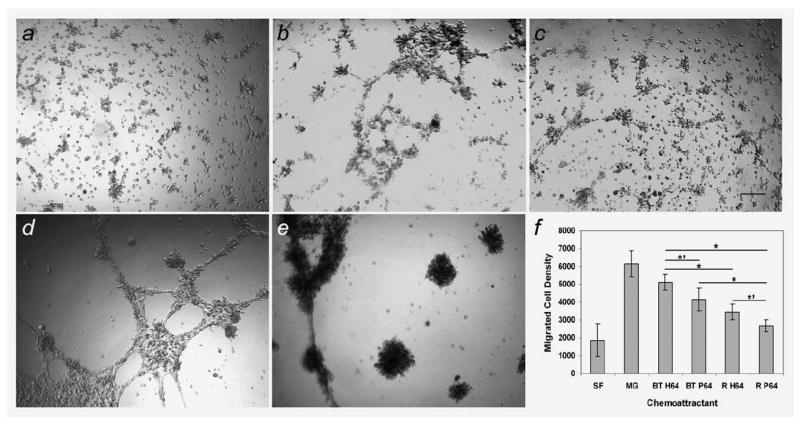
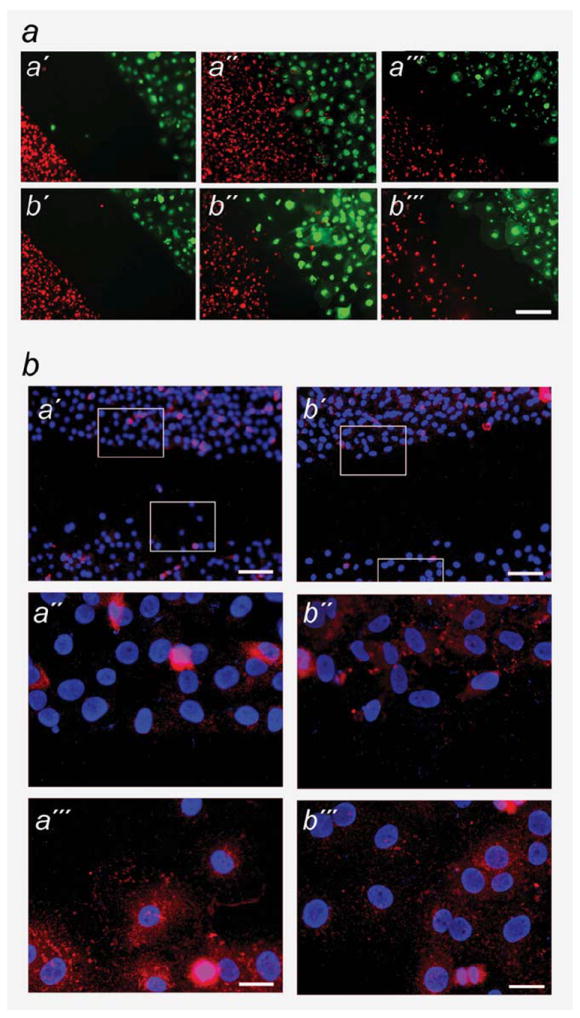
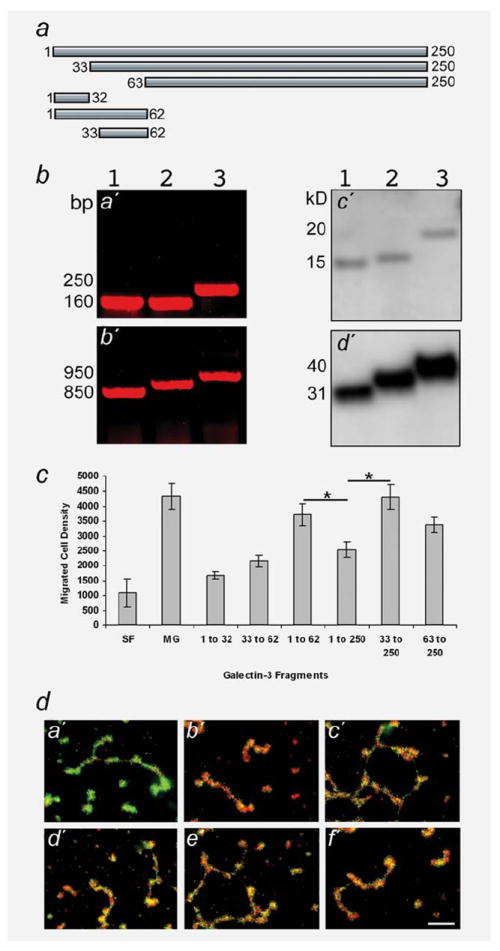
Galectin-3 cleavage is related to progression of human breast and prostate cancer and is partly responsible for tumor growth, angiogenesis and apoptosis resistance in mouse models. A functional polymorphism in galectin-3 gene, determining its susceptibility to cleavage by matrix metalloproteinases (MMPs)-2/-9 is related to racial disparity in breast cancer incidence in Asian and Caucasian women. The purpose of our study is to evaluate (i) if cleavage of galectin-3 could be related to angiogenesis during the progression of human breast cancer, (ii) the role of cleaved galectin-3 in induction of angiogenesis and (iii) determination of the galectin-3 domain responsible for induction of angiogenic response. Galectin-3 null breast cancer cells BT-459 were transfected with either cleavable full-length galectin-3 or its fragmented peptides. Chemotaxis, chemoinvasion, heterotypic aggregation, epithelial-endothelial cell interactions and angiogenesis were compared to noncleavable galectin-3. BT-549-H(64) cells harboring cleavable galectin-3 exhibited increased chemotaxis, invasion and interactions with endothelial cells resulting in angiogenesis and 3D morphogenesis compared to BT-549-P(64) cells harboring noncleavable galectin-3. BT-549-H(64) cells induced increased migration and phosphorylation of focal adhesion kinase in migrating endothelial cells. Endothelial cells cocultured with BT-549 cells transfected with galectin-3 peptides indicate that amino acids 1-62 and 33-250 stimulate migration and morphogenesis of endothelial cells. Immunohistochemical analysis of blood vessel density and galectin-3 cleavage in a breast cancer progression tissue array support the in vitro findings. We conclude that the cleavage of the N terminus of galectin-3 followed by its release in the tumor microenvironment in part leads to breast cancer angiogenesis and progression.


Figures

Figure 1
Figure 1
Cell morphology, expression, chemotaxis chemoinvasion and tumorigenic properties of BT-549-H/P64 cells. (aI) Schematic presentation of galectin-3 domains and H/P64 mutation around major MMP cleavage site; (aII) immunofluorescence of actin filaments 24 hr after seeding. (a′) Vector control, (b′) BT-549-H64 and (c′) BT-549-P64; scale bar 200 μm. (b) Western blot of cellular expression of galectin-3 in (I) total cell lysates; (II) the nuclear fraction; (III) conditioned medium; (IV) cell surface by flow cytometric analysis; (cI) chemotaxis toward 50 μg/mL collagen IV using Boyden chamber; (cII) chemoinvasion through Matrigel toward collagen IV. (a′) Vector control; (b′) BT-549-H64; (c′) BT-549-P64; (dI) Reduction of tumor growth in BT-549 cells transfected with noncleavable BT-549-P64 and vector control compared to BT-549-H64; (dII) Angiogenesis in BT-549-H64 (a′, b′) and G33P64 (a″, b″) xenografts using anti-CD34 (a′, a″) and anti-VEGF (b′, b″) antibodies. The IgG antibody control showed no reactivity (not shown). Arrows indicate positive staining. Scale bar 100 μm *p > 0.001.
Figure 2
Figure 2
Cleavage of galectin-3 in vivo. Upper panel: Western blots of conditioned media (40 μg total protein/lane) to analyze galectin-3 secretion and cleavage. H64/P64 status of the cell lines is indicated on top. Lower panel: gelatin zymography of conditioned media (10 μg total protein/lane) to monitor MMP-2 and -9 activity.
Figure 3
Figure 3
(a) Galectin-3 cleavage in breast cancer progression tissue array. Representative sections are shown. (a′–e′) Intact galectin-3 using TIB166 mAb. (a″–e″) Intact plus cleaved galectin-3 using anti-hL31 pAb. (a′, a″) Normal breast tissue; (b′, b″) Ductal hyperplasia; (c′, c″) lobular carcinoma in situ; (d′, d″) ductal carcinoma in situ; (e′, e″) infilterating carcinoma. Brown color represents positive staining. Arrows: intact galectin-3, arrowheads: cleaved galectin-3. Scale bar 100 μm. (b) Quantitation of cleavage of galectin-3 by counting grain density in each section and calculating percentage of cleaved galectin-3. Statistical analysis was performed between normal tissue and various progressive stages. *p < 0.005.
Figure 4
Figure 4
(a) Blood vessel density in breast cancer progression tissue array. (a′–e′) Smooth muscle actin; (a″–e″) pan keratin. (a′, a″) normal breast tissue; (b′, b″) lobular hyperplasia; (c′, c″) lobular carcinoma in situ; (d′, d″) ductal carcinoma in situ; (e′, e″) infiltrating carcinoma. Arrows: blood vessel; arrowheads: epithelial cells. Scale bar 50 μm. (b) Quantitation of blood vessels/section. Statistical analysis was performed between normal tissue and various progressive stages. *p < 0.005.
Figure 5
Figure 5
Effect of recombinant and secreted H64/P64 galectin-3 on endothelial cell morphogenesis and chemotaxis. 3D homotypic (a–c) and heterotypic (d, e) cultures of endothelial and BT-549-H64/P64 cell clones on Matrigel. (a) BAMEC cells; (b, c) BAMEC in the presence of 10 μg /mL rH64 (b) or rP64 (c) galectin-3, respectively; (d, e) BAMEC in the presence of equal number of BT-549-H64 or -P64 cells, respectively; scale bar 10 μm. (f) Chemotaxis of BAMEC toward unconcentrated conditioned media collected from BT-549-H64 or P64 cell clones and 10 μg/mL rH64 or rP64 using Boyden chamber. The membranes were scanned and arbitrary units were used on y-axis. The results are mean of 6 samples for each treatment. Bars represent standard deviation. *p < 0.001; *′p < 0.005.
Figure 6
Figure 6
Cell migration using wound healing assay. (a) BAMEC and BT-549-H/P64 cells were prelabeled with DiO and DiI, respectively, and seeded in each chamber of cell culture insert. After 24 hr, the inserts were removed and cell migration was studied. (a′–a′″) Migration of BAMEC and BT-549-H64; (b′–b′″) migration of BAMEC and BT-549-P64; (a′, b′) 0 hr, (a″, b″) 24 hr, (a′″, b′″) 24 hr in the presence of 10 μM MMP-2/MMP-9 inhibitor III. Scale bar 20 μm. (b) Expression of pFAK in migrating cells. The wound healing chambers were fixed at 8 hr with 3.5% paraformaldehyde, permeabilized with −20°C methanol acetone (1:1), stained with anti-pFAK antibodies and counterstained with DAPI. (a′) BT-549-H64 (at top) and BAMEC (at bottom). Scale bar 50 μm; (a″, a′″) higher magnifications of boxed areas in BT-549-H64 and BAMEC, respectively; scale bar 200 μm. (b′) BT-549-P64 (at top) and BAMEC (at bottom); scale bar 50 μm; (b″, b′″) higher magnifications of boxed areas in BT-549-P64 and BAMEC, respectively; scale bar 200 μm. Red grains represent positive pFAK staining.
Figure 7
Figure 7
Induction of chemotaxis and morphogenesis of endothelial cells by galectin-3 fragments. (a) Schematic representation of galectin-3 cleavage fragments; (b: a′, b′) mRNA synthesis in various cell clones by RT-PCR. (c′, d′) Western blot analysis of conditioned media from the clones harboring various fragments as fusion proteins. (a′, c′) Lanes 1: 1–32, 2: 33–62, 3: 1–62; (b′, d′) Lanes 1: 63–250, 2: 33–250, 3: 1–250. (c) Migration of endothelial cells using Boyden chamber toward unconcentrated conditioned media collected from clones expressing various galectin-3 fragments. Matrigel (MG) was used as a positive control. *p < 0.001. (d) 3D cocultures of BAMEC and BT-549 cells transfected with various galectin-3 fragments. Total tube forming units were calculated by measuring tube length between each cell cluster from 2 higher magnification pictures taken for each chamber. (a′) 1–32; (b′) 33–62; (c′) 1–62; (d′) 63–250; (e′) 33–250; (f′) 1–250; scale bar 20 μm.

Similar articles

Cited by

References

    1. Barondes SH, Cooper DN, Gitt MA, Leffler H. Galectins. Structure and function of a large family of animal lectins. J Biol Chem. 1994;269:20807–10. - PubMed
    1. Lotan R, Raz A. Low colony formation in vivo and in culture as exhibited by metastatic melanoma cells selected for reduced homotypic aggregation. Cancer Res. 1983;43:2088–93. - PubMed
    1. Meromsky L, Lotan R, Raz A. Implications of endogenous tumor cell surface lectins as mediators of cellular interactions and lung colonization. Cancer Res. 1986;46:5270–5. - PubMed
    1. Dumic J, Dabelic S, Flogel M. Galectin-3: an open-ended story. Biochim Biophys Acta. 2006;1760:616–35. - PubMed
    1. Gong HC, Honjo Y, Nangia-Makker P, Hogan V, Mazurak N, Bresalier RS, Raz A. The NH2 terminus of galectin-3 governs cellular compartmentalization and functions in cancer cells. Cancer Res. 1999;59:6239–45. - PubMed

Publication types

MeSH terms