

Thalamocortical sensorimotor circuit in multiple sclerosis: an integrated structural and electrophysiological assessment
- PMID: 20162580
- PMCID: PMC6871076
- DOI: 10.1002/hbm.20961
Thalamocortical sensorimotor circuit in multiple sclerosis: an integrated structural and electrophysiological assessment
Abstract
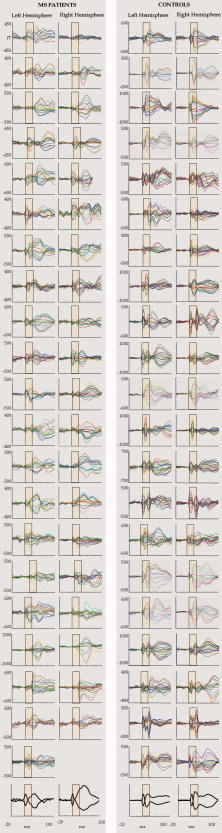
Demyelination and axonal damage are pathologic hallmarks of multiple sclerosis (MS), leading to loss of neuronal synchronization, functional disconnection amongst brain relays, and clinical sequelae. To investigate these properties, the primary component of the sensorimotor network was analyzed in mildly disabled Relapsing-Remitting MS patients without sensory symptoms at the time of the investigation. By magnetoencephalography (MEG), the recruitment pattern within the primary sensory (S1) and motor (M1) areas was estimated through the morphology of the early components of somatosensory evoked magnetic fields (SEFs), after evaluating the S1 responsiveness to sensory inputs from the contralateral arm. In each hemisphere, network recruitment properties were correlated with ispilateral thalamus volume, estimated by morphometric techniques upon high-resolution 3D structural magnetic resonance images (MRI). S1 activation was preserved, whereas SEF morphology was strikingly distorted in MS patients, marking a disruption of primary somatosensory network patterning. An unbalance of S1-M1 dynamic recruitment was documented and correlated with the thalamic volume reduction in the left hemisphere. These findings support the model of MS as a disconnection syndrome, with major susceptibility to damage experienced by nodes belonging to more frequently recruited and highly specialized networks.
© 2010 Wiley-Liss, Inc.
Figures


Similar articles
-
Neural connectivity in hand sensorimotor brain areas: an evaluation by evoked field morphology.Hum Brain Mapp. 2005 Feb;24(2):99-108. doi: 10.1002/hbm.20073. Hum Brain Mapp. 2005. PMID: 15468154 Free PMC article.
-
Intra-cortical connectivity in multiple sclerosis: a neurophysiological approach.Brain. 2008 Jul;131(Pt 7):1783-92. doi: 10.1093/brain/awn087. Epub 2008 May 23. Brain. 2008. PMID: 18502782
-
Area-Specific Synapse Structure in Branched Posterior Nucleus Axons Reveals a New Level of Complexity in Thalamocortical Networks.J Neurosci. 2020 Mar 25;40(13):2663-2679. doi: 10.1523/JNEUROSCI.2886-19.2020. Epub 2020 Feb 13. J Neurosci. 2020. PMID: 32054677 Free PMC article.
-
Integrated technology for evaluation of brain function and neural plasticity.Phys Med Rehabil Clin N Am. 2004 Feb;15(1):263-306. doi: 10.1016/s1047-9651(03)00124-4. Phys Med Rehabil Clin N Am. 2004. PMID: 15029909 Review.
-
Tracking functions of cortical networks on a millisecond timescale.Neural Netw. 2000 Oct-Nov;13(8-9):883-9. doi: 10.1016/s0893-6080(00)00061-7. Neural Netw. 2000. PMID: 11156199 Review.
Cited by
-
Chiropractic management using a brain-based model of care for a 15-year-old adolescent boy with migraine headaches and behavioral and learning difficulties: a case report.J Chiropr Med. 2013 Dec;12(4):274-80. doi: 10.1016/j.jcm.2013.10.005. J Chiropr Med. 2013. PMID: 24396330 Free PMC article.
-
Multiple sclerosis fatigue relief by bilateral somatosensory cortex neuromodulation.J Neurol. 2014 Aug;261(8):1552-8. doi: 10.1007/s00415-014-7377-9. Epub 2014 May 23. J Neurol. 2014. PMID: 24854634 Clinical Trial.
-
Diffuse cerebral language representation in tuberous sclerosis complex.Epilepsy Res. 2013 Mar;104(1-2):125-33. doi: 10.1016/j.eplepsyres.2012.09.011. Epub 2012 Oct 23. Epilepsy Res. 2013. PMID: 23092910 Free PMC article.
-
Functional balance at rest of hemispheric homologs assessed via normalized compression distance.Front Neurosci. 2024 Jan 25;17:1261701. doi: 10.3389/fnins.2023.1261701. eCollection 2023. Front Neurosci. 2024. PMID: 38333603 Free PMC article.
-
Thalamocortical-auditory network alterations following cuprizone-induced demyelination.J Neuroinflammation. 2016 Jun 22;13(1):160. doi: 10.1186/s12974-016-0629-0. J Neuroinflammation. 2016. PMID: 27334140 Free PMC article.
References
-
- Ahsan RL, Allom R, Gousias IS, Habib H, Turkheimer FE, Free S, Lemieux L, Myers R, Duncan JS, Brooks DJ, Koepp MJ, Hammers A ( 2007): Volumes, spatial extents and a probabilistic atlas of the human basal ganglia and thalamus. Neuroimage 38: 261–270. - PubMed
-
- Amunts K, Schleicher A, Ditterich A, Zilles K ( 2003): Broca's region: Cytoarchitectonic asymmetry and developmental changes. J Comp Neurol 465: 72–89. - PubMed
-
- Asanuma H, Larsen KD, Yumiya H ( 1979): Receptive fields of thalamic neurons projecting to the motor cortex in the cat. Brain Res 172: 217–228. - PubMed
-
- Asanuma H, Larsen K, Yumiya H ( 1980): Peripheral input pathways to the monkey motor cortex. Exp Brain Res 38: 349–355. - PubMed
Publication types
MeSH terms
LinkOut - more resources
Full Text Sources
Other Literature Sources
Medical
