

Scan-rescan reliability of subcortical brain volumes derived from automated segmentation
- PMID: 20162602
- PMCID: PMC3782252
- DOI: 10.1002/hbm.20973
Scan-rescan reliability of subcortical brain volumes derived from automated segmentation
Abstract
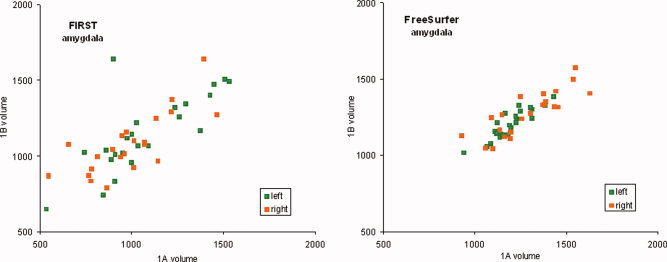
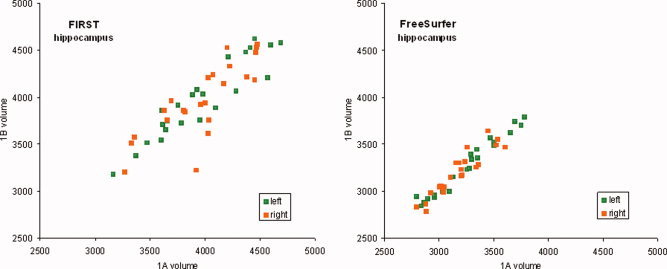
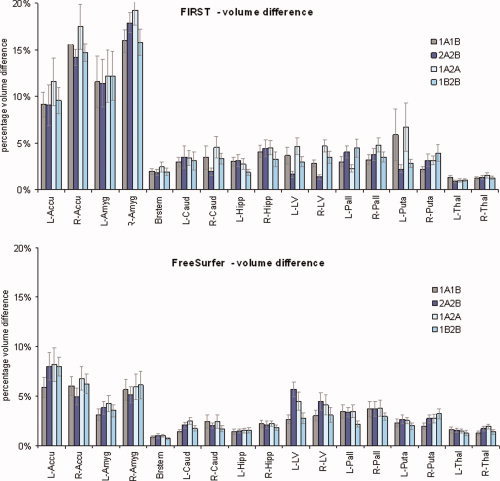
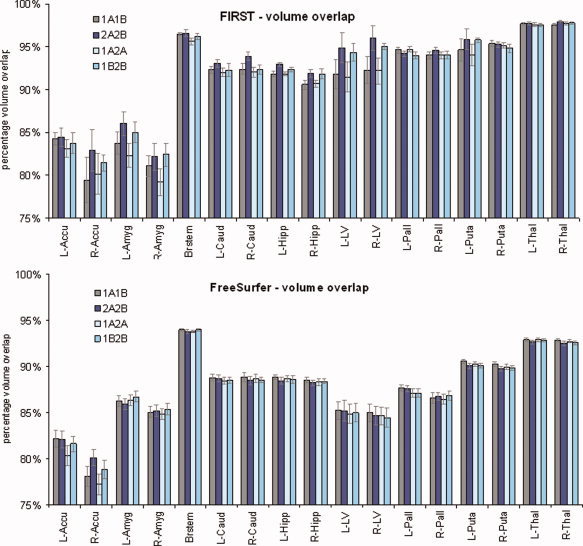
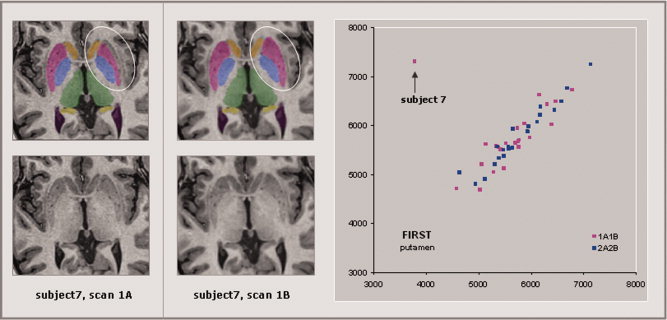
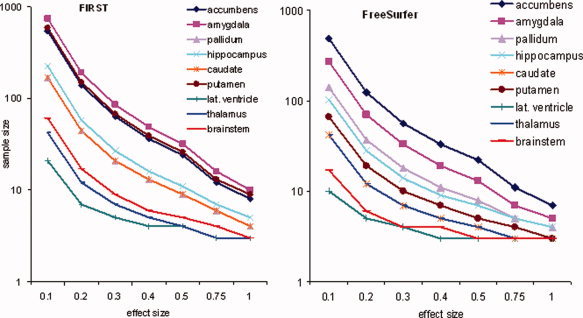
Large-scale longitudinal studies of regional brain volume require reliable quantification using automated segmentation and labeling. However, repeated MR scanning of the same subject, even if using the same scanner and acquisition parameters, does not result in identical images due to small changes in image orientation, changes in prescan parameters, and magnetic field instability. These differences may lead to appreciable changes in estimates of volume for different structures. This study examined scan-rescan reliability of automated segmentation algorithms for measuring several subcortical regions, using both within-day and across-day comparison sessions in a group of 23 normal participants. We found that the reliability of volume measures including percent volume difference, percent volume overlap (Dice's coefficient), and intraclass correlation coefficient (ICC), varied substantially across brain regions. Low reliability was observed in some structures such as the amygdala (ICC = 0.6), with higher reliability (ICC = 0.9) for other structures such as the thalamus and caudate. Patterns of reliability across regions were similar for automated segmentation with FSL/FIRST and FreeSurfer (longitudinal stream). Reliability was associated with the volume of the structure, the ratio of volume to surface area for the structure, the magnitude of the interscan interval, and the method of segmentation. Sample size estimates for detecting changes in brain volume for a range of likely effect sizes also differed by region. Thus, longitudinal research requires a careful analysis of sample size and choice of segmentation method combined with a consideration of the brain structure(s) of interest and the magnitude of the anticipated effects.
© 2010 Wiley-Liss, Inc.
Figures
References
-
- Agartz I, Okuguwa G, Nordstrom M, Greitz D, Magnotta V, Sedvall G ( 2001): Reliability and reproducibility of brain tissue volumetry from segmented MR scans. Eur Arch Psychiatry Clin Neurosci 251: 255–261. - PubMed
-
- Barnes J, Foster J, Boyes RG, Pepple T, Moore EK, Schott JM, Frost C, Scahill RI, Fox NC ( 2008): A comparison of methods for the automated calculation of volumes and atrophy rates in the hippocampus. Neuroimage 40: 1655–1671. - PubMed
-
- Bartzokis G, Mintz J, Marx P, Osborn D, Gutkind D, Chiang F, Phelan CK, Marder SR ( 1993): Reliability of in vivo volume measures of hippocampus and other brain structures using MRI. Magn Reson Imaging 11: 993–1006. - PubMed
-
- Castellanos FX, Lee PP, Sharp W, Jeffries NO, Greenstein DK, Clasen LS, Blumenthal JD, James RS, Ebens CL, Walter JM, et al ( 2002): Developmental trajectories of brain volume abnormalities in children and adolescents with attention‐deficit/hyperactivity disorder. JAMA 288: 1740–1748. - PubMed
Publication types
MeSH terms
Grants and funding
LinkOut - more resources
Full Text Sources
Medical
