

Abnormalities of cell packing density and dendritic complexity in the MeCP2 A140V mouse model of Rett syndrome/X-linked mental retardation
- PMID: 20163734
- PMCID: PMC2836362
- DOI: 10.1186/1471-2202-11-19
Abnormalities of cell packing density and dendritic complexity in the MeCP2 A140V mouse model of Rett syndrome/X-linked mental retardation
Abstract
Background: Rett syndrome (RTT), a common cause of mental retardation in girls, is associated with mutations in the MECP2 gene. Most human cases of MECP2 mutation in girls result in classical or variant forms of RTT. When these same mutations occur in males, they often present as severe neonatal encephalopathy. However, some MECP2 mutations can also lead to diseases characterized as mental retardation syndromes, particularly in boys. One of these mutations, A140V, is a common, recurring missense mutation accounting for about 0.6% of all MeCP2 mutations and ranking 21st by frequency. It has been described in familial X-linked mental retardation (XLMR), PPM- X syndrome (Parkinsonism, Pyramidal signs, Macroorchidism, X-linked mental retardation) and in other neuropsychiatric syndromes. Interestingly, this mutation has been reported to preserve the methyl-CpG binding function of the MeCP2 protein while compromising its ability to bind to the mental retardation associated protein ATRX.
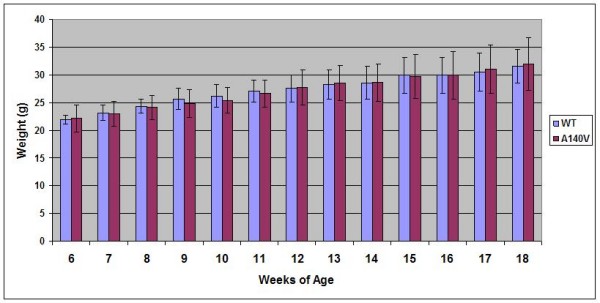
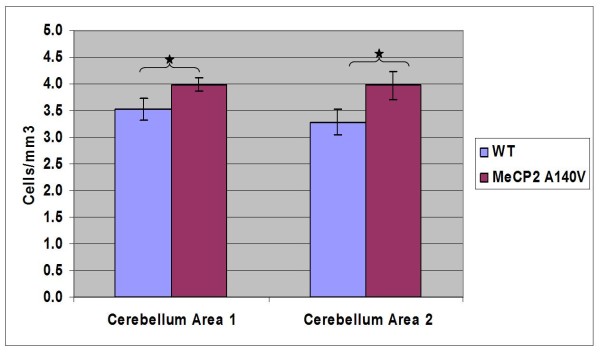
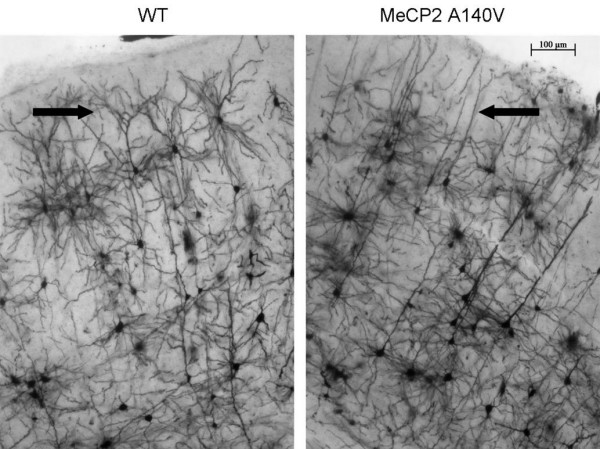
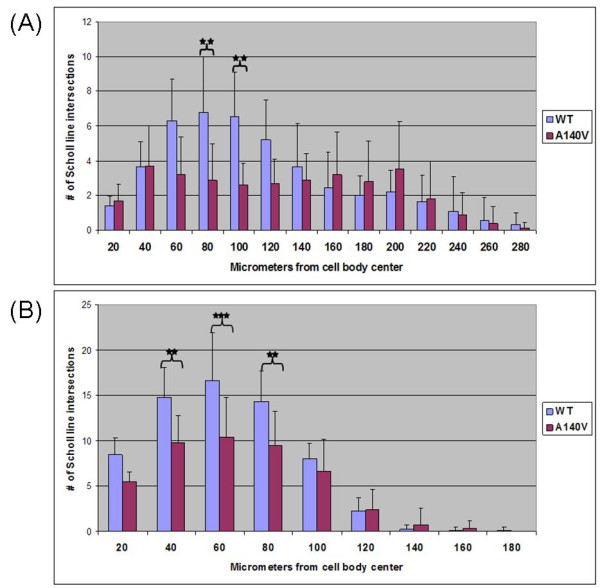
Results: We report the construction and initial characterization of a mouse model expressing the A140V MeCP2 mutation. These initial descriptive studies in male hemizygous mice have revealed brain abnormalities seen in both RTT and mental retardation. The abnormalities found include increases in cell packing density in the brain and a significant reduction in the complexity of neuronal dendritic branching. In contrast to some MeCP2 mutation mouse models, the A140V mouse has an apparently normal lifespan and normal weight gain patterns with no obvious seizures, tremors, breathing difficulties or kyphosis.
Conclusion: We have identified various neurological abnormalities in this mouse model of Rett syndrome/X-linked mental retardation which may help to elucidate the manner in which MECP2 mutations cause neuronal changes resulting in mental retardation without the confounding effects of seizures, chronic hypoventilation, or other Rett syndrome associated symptoms.
Figures
Similar articles
-
Electrophysiological phenotypes of MeCP2 A140V mutant mouse model.CNS Neurosci Ther. 2014 May;20(5):420-8. doi: 10.1111/cns.12229. CNS Neurosci Ther. 2014. PMID: 24750778 Free PMC article.
-
Neuronal morphology in MeCP2 mouse models is intrinsically variable and depends on age, cell type, and Mecp2 mutation.Neurobiol Dis. 2013 Oct;58:3-12. doi: 10.1016/j.nbd.2013.04.020. Epub 2013 May 6. Neurobiol Dis. 2013. PMID: 23659895 Free PMC article.
-
Dendritic spine pathologies in hippocampal pyramidal neurons from Rett syndrome brain and after expression of Rett-associated MECP2 mutations.Neurobiol Dis. 2009 Aug;35(2):219-33. doi: 10.1016/j.nbd.2009.05.001. Epub 2009 May 12. Neurobiol Dis. 2009. PMID: 19442733 Free PMC article.
-
MECP2 disorders: from the clinic to mice and back.J Clin Invest. 2015 Aug 3;125(8):2914-23. doi: 10.1172/JCI78167. Epub 2015 Aug 3. J Clin Invest. 2015. PMID: 26237041 Free PMC article. Review.
-
Rett syndrome: the complex nature of a monogenic disease.J Mol Med (Berl). 2003 Jun;81(6):346-54. doi: 10.1007/s00109-003-0444-9. Epub 2003 May 16. J Mol Med (Berl). 2003. PMID: 12750821 Review.
Cited by
-
Daily rhythmic behaviors and thermoregulatory patterns are disrupted in adult female MeCP2-deficient mice.PLoS One. 2012;7(4):e35396. doi: 10.1371/journal.pone.0035396. Epub 2012 Apr 16. PLoS One. 2012. PMID: 22523589 Free PMC article.
-
Electrophysiological phenotypes of MeCP2 A140V mutant mouse model.CNS Neurosci Ther. 2014 May;20(5):420-8. doi: 10.1111/cns.12229. CNS Neurosci Ther. 2014. PMID: 24750778 Free PMC article.
-
Rett syndrome: disruption of epigenetic control of postnatal neurological functions.Hum Mol Genet. 2015 Oct 15;24(R1):R10-6. doi: 10.1093/hmg/ddv217. Epub 2015 Jun 9. Hum Mol Genet. 2015. PMID: 26060191 Free PMC article. Review.
-
Reduced neuronal size and mTOR pathway activity in the Mecp2 A140V Rett syndrome mouse model.F1000Res. 2016 Sep 8;5:2269. doi: 10.12688/f1000research.8156.1. eCollection 2016. F1000Res. 2016. PMID: 27781091 Free PMC article.
-
Late effects of 1H irradiation on hippocampal physiology.Life Sci Space Res (Amst). 2018 May;17:51-62. doi: 10.1016/j.lssr.2018.03.004. Epub 2018 Mar 15. Life Sci Space Res (Amst). 2018. PMID: 29753414 Free PMC article.
References
Publication types
MeSH terms
Substances
Grants and funding
LinkOut - more resources
Full Text Sources
Other Literature Sources
Medical
Molecular Biology Databases
