Dual-color proteomic profiling of complex samples with a microarray of 810 cancer-related antibodies
- PMID: 20164060
- PMCID: PMC2877986
- DOI: 10.1074/mcp.M900419-MCP200
Dual-color proteomic profiling of complex samples with a microarray of 810 cancer-related antibodies
Abstract
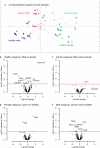
Antibody microarrays have the potential to enable comprehensive proteomic analysis of small amounts of sample material. Here, protocols are presented for the production, quality assessment, and reproducible application of antibody microarrays in a two-color mode with an array of 1,800 features, representing 810 antibodies that were directed at 741 cancer-related proteins. In addition to measures of array quality, we implemented indicators for the accuracy and significance of dual-color detection. Dual-color measurements outperform a single-color approach concerning assay reproducibility and discriminative power. In the analysis of serum samples, depletion of high-abundance proteins did not improve technical assay quality. On the contrary, depletion introduced a strong bias in protein representation. In an initial study, we demonstrated the applicability of the protocols to proteins derived from urine samples. We identified differences between urine samples from pancreatic cancer patients and healthy subjects and between sexes. This study demonstrates that biomedically relevant data can be produced. As demonstrated by the thorough quality analysis, the dual-color antibody array approach proved to be competitive with other proteomic techniques and comparable in performance to transcriptional microarray analyses.
Figures


Similar articles
-
Robust protein profiling with complex antibody microarrays in a dual-colour mode.Methods Mol Biol. 2011;785:203-21. doi: 10.1007/978-1-61779-286-1_14. Methods Mol Biol. 2011. PMID: 21901602
-
Optimized normalization for antibody microarrays and application to serum-protein profiling.Mol Cell Proteomics. 2005 Jun;4(6):773-84. doi: 10.1074/mcp.M400180-MCP200. Epub 2005 Mar 25. Mol Cell Proteomics. 2005. PMID: 15793073
-
Proteome analysis of human pancreatic cancer cell lines with highly liver metastatic potential by antibody microarray.Mol Cell Biochem. 2011 Jan;347(1-2):117-25. doi: 10.1007/s11010-010-0619-y. Epub 2010 Oct 20. Mol Cell Biochem. 2011. PMID: 20960035
-
Systematic antibody and antigen-based proteomic profiling with microarrays.Expert Rev Mol Diagn. 2011 Mar;11(2):219-34. doi: 10.1586/erm.10.110. Expert Rev Mol Diagn. 2011. PMID: 21405972 Review.
-
Antibody-Based Proteomics.Adv Exp Med Biol. 2016;926:163-179. doi: 10.1007/978-3-319-42316-6_11. Adv Exp Med Biol. 2016. PMID: 27686812 Review.
Cited by
-
Current applications of antibody microarrays.Clin Proteomics. 2018 Feb 28;15:7. doi: 10.1186/s12014-018-9184-2. eCollection 2018. Clin Proteomics. 2018. PMID: 29507545 Free PMC article. Review.
-
Protein analytical assays for diagnosing, monitoring, and choosing treatment for cancer patients.J Healthc Eng. 2012 Dec;3(4):503-534. doi: 10.1260/2040-2295.3.4.503. J Healthc Eng. 2012. PMID: 25147725 Free PMC article.
-
Spatiotemporal proteomic analyses during pancreas cancer progression identifies serine/threonine stress kinase 4 (STK4) as a novel candidate biomarker for early stage disease.Mol Cell Proteomics. 2014 Dec;13(12):3484-96. doi: 10.1074/mcp.M113.036517. Epub 2014 Sep 15. Mol Cell Proteomics. 2014. PMID: 25225358 Free PMC article.
-
Diagnosis of pancreatic ductal adenocarcinoma and chronic pancreatitis by measurement of microRNA abundance in blood and tissue.PLoS One. 2012;7(4):e34151. doi: 10.1371/journal.pone.0034151. Epub 2012 Apr 12. PLoS One. 2012. PMID: 22511932 Free PMC article.
-
Antibody-based proteomics: fast-tracking molecular diagnostics in oncology.Nat Rev Cancer. 2010 Sep;10(9):605-17. doi: 10.1038/nrc2902. Epub 2010 Aug 19. Nat Rev Cancer. 2010. PMID: 20720569 Review.
References
-
- Hanash S. M., Pitteri S. J., Faca V. M. (2008) Mining the plasma proteome for cancer biomarkers. Nature 452, 571–579 - PubMed
-
- Koomen J. M., Haura E. B., Bepler G., Sutphen R., Remily-Wood E. R., Benson K., Hussein M., Hazlehurst L. A., Yeatman T. J., Hildreth L. T., Sellers T. A., Jacobsen P. B., Fenstermacher D. A., Dalton W. S. (2008) Proteomic contributions to personalized cancer care. Mol. Cell. Proteomics 7, 1780–1794 - PMC - PubMed
-
- Ghosh D., Poisson L. M. (2009) “Omics” data and levels of evidence for biomarker discovery. Genomics 93, 13–16 - PubMed
-
- Mischak H., Apweiler R., Banks R. E., Conaway M., Coon J., Dominiczak A., Ehrich J. H. H., Fliser D., Girolami M., Hermjakob H., Hochstrasser D., Jankowski J., Julian B. A., Kolch W., Massy Z. A., Neusuess C., Novak J., Peter K., Rossing K., Schanstra J., Semmes O. J., Theodorescu D., Thongboonkerd V., Weissinger E. M., Eyk J. E. V., Yamamoto T. (2007) Clinical proteomics: A need to define the field and to begin to set adequate standards. Proteomics Clin. Appl 1, 148–156 - PubMed
Publication types
MeSH terms
Substances
LinkOut - more resources
Full Text Sources
Other Literature Sources
Research Materials

