. 2010 Apr 1;26(7):889-95.
doi: 10.1093/bioinformatics/btq066. Epub 2010 Feb 17.

How significant is a protein structure similarity with TM-score = 0.5?

Affiliations

How significant is a protein structure similarity with TM-score = 0.5?

Jinrui Xu et al. Bioinformatics. .

Abstract

Motivation: Protein structure similarity is often measured by root mean squared deviation, global distance test score and template modeling score (TM-score). However, the scores themselves cannot provide information on how significant the structural similarity is. Also, it lacks a quantitative relation between the scores and conventional fold classifications. This article aims to answer two questions: (i) what is the statistical significance of TM-score? (ii) What is the probability of two proteins having the same fold given a specific TM-score?

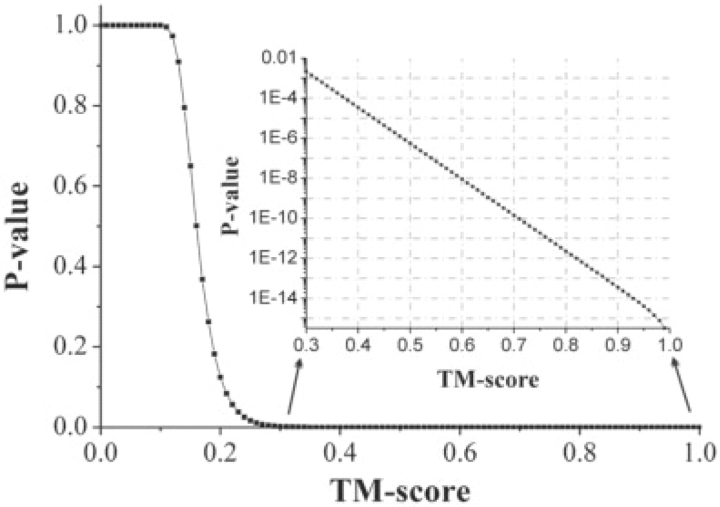
Results: We first made an all-to-all gapless structural match on 6684 non-homologous single-domain proteins in the PDB and found that the TM-scores follow an extreme value distribution. The data allow us to assign each TM-score a P-value that measures the chance of two randomly selected proteins obtaining an equal or higher TM-score. With a TM-score at 0.5, for instance, its P-value is 5.5 x 10(-7), which means we need to consider at least 1.8 million random protein pairs to acquire a TM-score of no less than 0.5. Second, we examine the posterior probability of the same fold proteins from three datasets SCOP, CATH and the consensus of SCOP and CATH. It is found that the posterior probability from different datasets has a similar rapid phase transition around TM-score=0.5. This finding indicates that TM-score can be used as an approximate but quantitative criterion for protein topology classification, i.e. protein pairs with a TM-score >0.5 are mostly in the same fold while those with a TM-score <0.5 are mainly not in the same fold.


Figures

Fig. 1.
Fig. 1.
Venn diagram of datasets of the same/different folds. Set-I contains 746 420 same Fold domain pairs generated from 11 239 protein domains in SCOP. Set-II consists of 2 769 868 same Topology domain pairs generated from 14 830 protein domains in CATH. Set-III is the overlap part of Set-I and Set-II, which includes 186 359 pairs from 5105 consensus domains. Set-IV contains 13 027 960 all-to-all pairs from the 5105 consensus domains. Set-I′ is the different fold set for SCOP, generated by subtracting a subset of Set-I from Set-IV. Set-II′ is the different fold set for CATH, generated by subtracting a subset of Set-II from Set-IV. Set-III′ is the different fold set for Set-III and obtained by subtracting subsets of Set-I and Set-II from Set-IV.
Fig. 2.
Fig. 2.
TM-score distribution of 71 583 085 gapless comparisons among 6684 non-homologous protein structures. The continuous curve represents an EVD with the location parameter and the scale parameter being 0.1512 and 0.0242, respectively; the reduced χ2 of fitting is 0.001 obtained by the Evfit module of MATLAB7 software. The TM-score distributions of four subdivisions are from proteins with length in [80, 100], [101, 120], [121, 160] and [161, 200], respectively.
Fig. 3.
Fig. 3.
The P-value versus TM-score. The curve is a sigmoid like Boltzmann function with reduced χ2 equal to 0.0001. Inset: P-value (in logarithm scale) versus TM-score in [0.3, 1].
Fig. 4.
Fig. 4.
The average TM-scores (with error bars) of gapless alignment matches on random structural pairs with protein length from 80 to 200 amino acids. The straight and dash lines above TM-scores=0.2 indicate the number of random protein pairs (values on the right-hand side) needed to achieve or surpass a certain TM-score level. By doing random structure comparisons in 102, 104, 1010 and 1016 times, one can hit a match with a TM-score ≥0.263, 0.374, 0.709 and 0.977, respectively. 1.8 × 10⁶ random matches are needed to achieve a TM-score ≥0.5.
Fig. 5.
Fig. 5.
The conditional probabilities of TM-score for proteins in the same fold and different fold families as defined by SCOP (Set-I; Set-II′), CATH (Set-II; Set-II) and SCOP and CATH (Set-III; Set-III).
Fig. 6.
Fig. 6.
The posterior probability of proteins with a given TM-score being in the same Fold (squares, triangles and stars points) or different Fold family (circle points). The Fold family is defined based on either the SCOP Fold level (SCOP, Set-I) or the CATH Topology level (CATH, Set-II) or a consensus of SCOP Fold and CATH Topology families (Consensus, Set-III).

References

    1. Andreeva A, et al. Data growth and its impact on the SCOP database: new developments. Nucleic Acids Res. 2008;36:D419–D425. - PMC - PubMed
    1. Ben-David M, et al. Assess ment of CASP8 structure predictions for template free targets. Proteins. 2009;77(Suppl. 9):50–65. - PubMed
    1. Berman HM, et al. The protein data bank. Acta Crystallogr., Sect D: Biol. Crystallogr. 2002;58:899–907. - PubMed
    1. Betancourt MR, Skolnick J. Universal similarity measure for comparing protein structures. Biopolymers. 2001;59:305–309. - PubMed
    1. Chothia C, et al. Evolution of the protein repertoire. Science. 2003;300:1701–1703. - PubMed

Publication types