. 2010 Apr 23;285(17):12813-22.
doi: 10.1074/jbc.M109.075762. Epub 2010 Feb 17.

A two-step process controls the formation of the bienzyme cysteine synthase complex

Affiliations

A two-step process controls the formation of the bienzyme cysteine synthase complex

Enea Salsi et al. J Biol Chem. .

Abstract

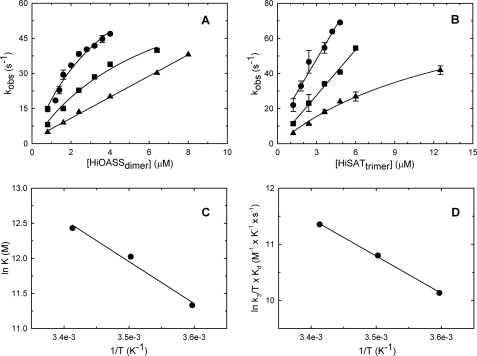
The regulation of enzyme activity through the transient formation of multiprotein assemblies plays an important role in the control of biosynthetic pathways. One of the first regulatory complexes to be discovered was cysteine synthase (CS), formed by the pyridoxal 5'-phosphate-dependent enzyme O-acetylserine sulfhydrylase (OASS) and serine acetyltransferase (SAT). These enzymes are at the branch point of the sulfur, carbon, and nitrogen assimilation pathways. Understanding the mechanism of complex formation helps to clarify the role played by CS in the regulation of sulfur assimilation in bacteria and plants. To this goal, stopped-flow fluorescence spectroscopy was used to characterize the interaction of SAT with OASS, at different temperatures and pH values, and in the presence of the physiological regulators cysteine and bisulfide. Results shed light on the mechanism of complex formation and regulation, so far poorly understood. Cysteine synthase assembly occurs via a two-step mechanism involving rapid formation of an encounter complex between the two enzymes, followed by a slow conformational change. The conformational change likely results from the closure of the active site of OASS upon binding of the SAT C-terminal peptide. Bisulfide, the second substrate and a feedback inhibitor of OASS, stabilizes the CS complex mainly by decreasing the back rate of the isomerization step. Cysteine, the product of the OASS reaction and a SAT inhibitor, slightly affects the kinetics of CS formation leading to destabilization of the complex.


Figures

SCHEME 1.
SCHEME 1.
Reductive sulfate assimilation pathway in bacteria and its relations with the nitrogen and carbon assimilation pathways. Enzyme names are shown in boldface with the exception of SAT and OASS that are shown in red. Modulation of enzyme or transcriptional activity is shown with blue arrows; cysteine feedback inhibits the activity of SAT; SAT inhibits OASS activity; N-acetylserine, the product of spontaneous O-N transfer of the acetyl group of OAS, induces the transcription of the cysteine operon. Abbreviations used are as follows: ATPS, ATP sulfurylase; APSK, 5′-phosphosulfate kinase; PAPS ST, 3′-phosphoadenosine 5′-phosphosulfate sulfotransferase; NADPH-SR, NADPH-dependent sulfite reductase; PGDH, d-3-phosphoglycerate dehydrogenase; PSAT, 3-phosphoserine aminotransferase; PSP, 3-phosphoserine phosphatase; GluDH, glutamate dehydrogenase.
FIGURE 1.
FIGURE 1.
Three-dimensional structures of OASS and SAT. A, three-dimensional structure of H. influenzae SAT bound to acetyl-CoA (Protein Data Bank code 1sst (27)). The two trimers that form the hexamer are depicted in pink and green shades. Acetyl-CoA is shown in stick mode. B, three-dimensional structure of the complex between H. influenzae OASS and SAT C-terminal decapeptide (only the last four residues were visible in the density map. Protein Data Bank code 1y7l (9)). The two subunits are depicted in green and dark cyan, and the peptides are shown in stick mode. The cofactor is shown in yellow. C, close-up of the active site of H. influenzae OASS bound to SAT C-terminal peptide (9). The protein residues that interact with the peptide are shown in yellow; the tetrapeptide Ile267–Asn266–Leu265–Asn264 is shown in violet, and the cofactor is shown in cyan. Figures were prepared with PyMOL (57).
FIGURE 2.
FIGURE 2.
Interaction of OASS and SAT as monitored by changes of fluorescence emission of PLP. Representative time courses for the reaction of OASS with SAT recorded by monitoring the fluorescence emission intensity upon excitation at 412 nm. Time courses were recorded at pH 7, 100 mm Hepes, with the concentration of OASSdimer fixed at 800 nm and the concentration of SATtrimer fixed at 80 nm. Time courses were obtained at 20 °C (black line), 12 °C (dark gray line), and 5 °C (light gray line). The dashed lines through data points represent the fit to Equation 1. Inset, fluorescence emission spectra of OASS (1.2 μm) at pH 7, 100 mm Hepes, in the absence (solid line) and presence (dashed line) of 10 μm SAT. Excitation was at 412 nm with slitex and slitem set at 5 nm. A.U., arbitrary units.
FIGURE 3.
FIGURE 3.
Observed kinetic constants for the interaction of OASS and SAT as a function of temperature. A and B, dependence of kobs on the concentration of OASS and SAT. Experiments were carried out in 100 mm Hepes, pH 7, varying OASSdimer concentrations at a fixed 80 nm SATtrimer concentration (A) and varying SAT concentrations at a fixed 120 nm OASSdimer concentration (B) at 20 °C (circles), 12 °C (squares), and 5 °C (triangles). The solid lines through data points represent the fit to Equations 2 and 3. Fitted parameters are summarized in Table 1. C and D, van't Hoff and Eyring plots. The natural logarithm of K (C) and k3/Kd·T (D) obtained from fitting of dependences shown in A and B were plotted against 1/T to obtain the van't Hoff and Eyring plots, respectively. Fitting to Equations 4 and 5 allows us to calculate the following parameters: ΔH0 of 11.9 ± 1.6 kcal/mol and a ΔS0 of 0.066 ± 0.005 kcal/K·mol, from the van't Hoff plot and ΔH = 13.1 ± 0.1 kcal/mol and ΔS = 0.020 ± 0.002 kcal/K·mol from the Eyring plot.

Similar articles

Cited by

References

    1. Ovadi J. (1991) J. Theor. Biol. 152, 1–22 - PubMed
    1. Huang X., Holden H. M., Raushel F. M. (2001) Annu. Rev. Biochem. 70, 149–180 - PubMed
    1. Miles E. W., Rhee S., Davies D. R. (1999) J. Biol. Chem. 274, 12193–12196 - PubMed
    1. Bernhard S. A. (1988) Cell Biophys. 12, 119–132 - PubMed
    1. Raboni S., Pioselli B., Bettati S., Mozzarelli A. (2003) Biochim. Biophys. Acta 1647, 157–160 - PubMed

Publication types

MeSH terms