. 2010 Apr 16;285(16):12159-68.
doi: 10.1074/jbc.M109.067629. Epub 2010 Feb 17.

Hepatitis B virus protein X-induced expression of the CXC chemokine IP-10 is mediated through activation of NF-kappaB and increases migration of leukocytes

Affiliations

Hepatitis B virus protein X-induced expression of the CXC chemokine IP-10 is mediated through activation of NF-kappaB and increases migration of leukocytes

Yu Zhou et al. J Biol Chem. .

Abstract

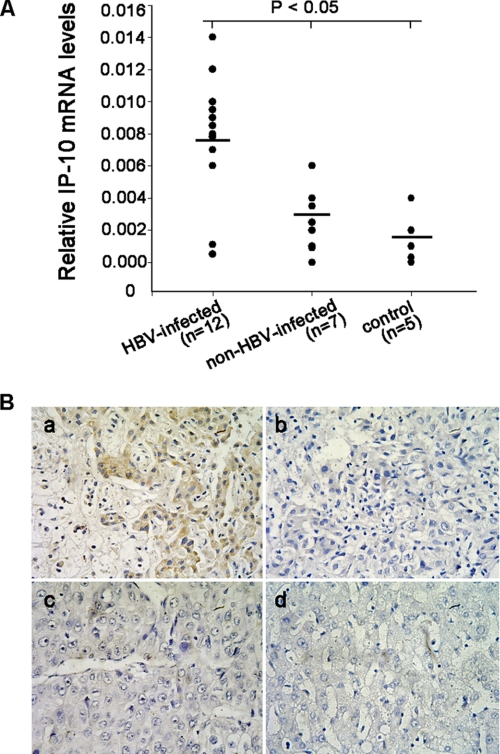
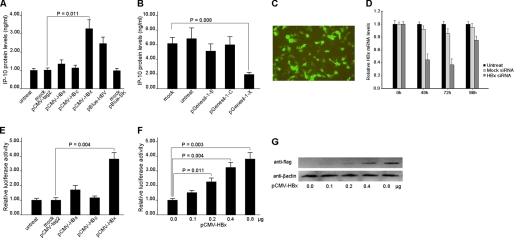
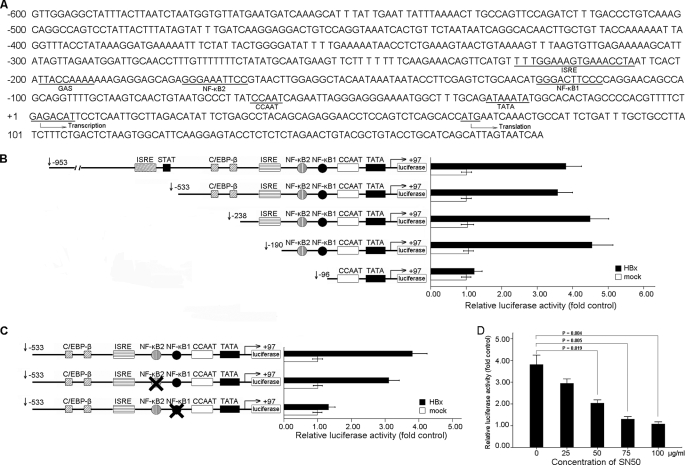
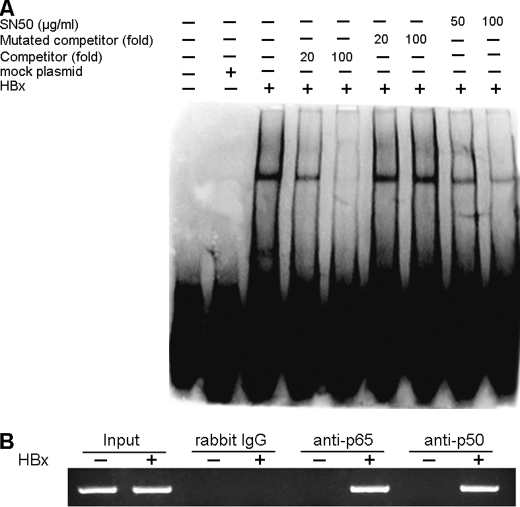
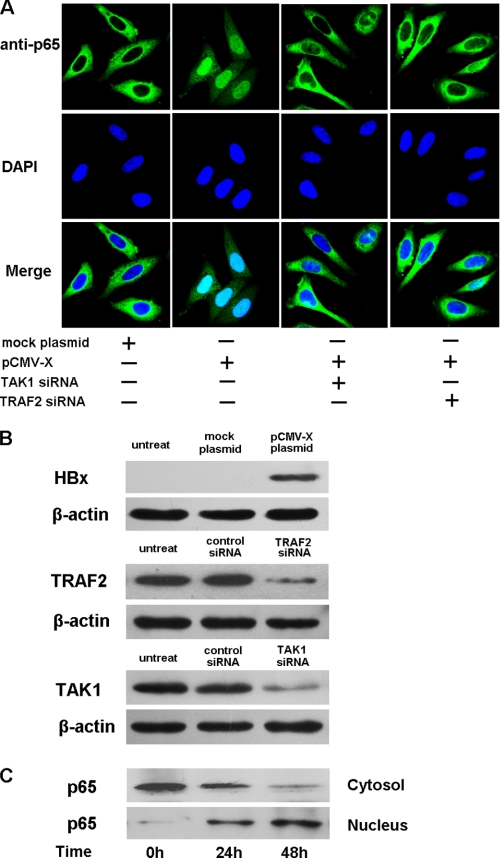
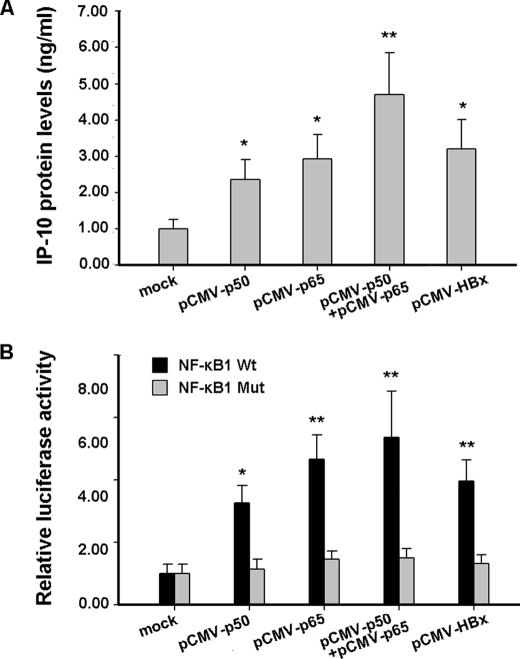
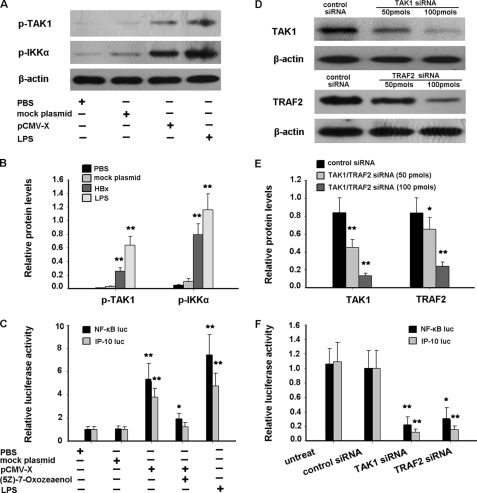
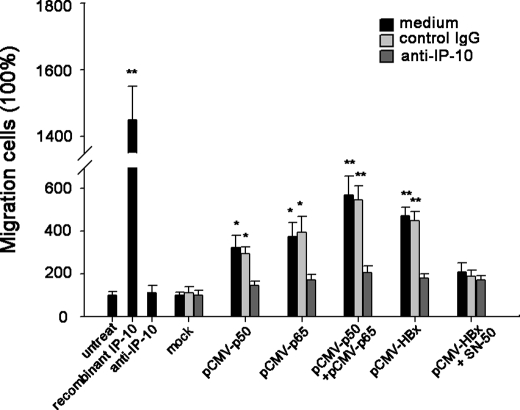
Interferon-gamma inducible protein 10 (IP-10) involves inflammatory cell recruitment and cellular immune damage during virus infection. Although an increase of the peripheral IP-10 level is known in HBV-infected patients, the molecular basis of HBV infection inducing IP-10 expression has remained elusive. In the present study, we demonstrate that hepatitis B virus protein X (HBx) increases IP-10 expression in a dose-dependent manner. Transfection of the HBx-expressing vector into HepG2 cells results in nuclear translocation of NF-kappaB, which directly binds the promoter of IP-10 at positions from -122 to -113, thus facilitating transcription. The addition of the NF-kappaB inhibitor blocks the effect of HBx on IP-10 induction. In parallel, increase of NF-kappaB subunits p65 and p50 in HepG2 cells also augments IP-10 expression. Furthermore, we show that HBx induces activation of NF-kappaB through the TRAF2/TAK1 signaling pathway, leading to up-regulation of IP-10 expression. As a consequence, up-regulation of IP-10 may mediate the migration of peripheral blood leukocytes in a NF-kappaB-dependent manner. In conclusion, we report a novel molecular mechanism of HBV infection inducing IP-10 expression, which involves viral protein HBx affecting NF-kappaB pathway, leading to transactivation of the IP-10 promoter. Our study provides insight into the migration of leukocytes in response to HBV infection, thus causing immune pathological injury of liver.


Figures

FIGURE 1.
FIGURE 1.
IP-10 expression in human liver tissues. A, real time PCR detection of IP-10 mRNA expression in HBV-infected, non-HBV-infection, and normal control liver tissues. Results are mean ± S.D. of three experiments performed in duplicate and relative to the housekeeping gene GAPDH. Bars represent mean. B, detection of IP-10 protein expression in liver tissue by immunohistochemistry. a, immunoreactive IP-10 protein was mainly visualized on sinusoidal endothelium and hepatocytes in HBV-infected liver cancer tissue; b, isotype IgG was used as a negative control in HBV-infection liver cancer tissue; c, immunoreactive IP-10 protein was scarcely visualized in non-HBV-infection liver cancer tissue; d, in normal control liver tissues, the IP-10 protein could not be detected by immunohistochemistry.
FIGURE 2.
FIGURE 2.
HBx protein induces IP-10 expression. A, the full-length gene of HBV (pBlue-HBV) and plasmids expressing different HBV proteins were transfected into HepG2 cells, respectively. The protein levels of IP-10 were measured by the ELISA kit. Transfection efficiency was 35.8 ± 6.2%. Results are mean ± S.D. of three experiments performed in duplicate. Error bars represent S.D. siRNA-expressing vectors targeting different HBV proteins and mock plasmids were transfected into HepG2.2.15 cells, respectively. The supernatant protein levels of IP-10 were analyzed by the ELISA kit. The transfection efficiency was 41.6 ± 7.4%. The results are representative of three experiments. C, transfection efficiency of GFP-expressing HBx siRNA plasmids into HepG2.2.15 cells were observed under a fluorescence microscope. D, siRNA-expressing vectors targeting HBx proteins and mock plasmids were transfected into HepG2.2.15 cells, respectively. The HBx mRNA levels were analyzed by real time PCR after 48, 72, and 96 h. The mRNA levels of HBx in HepG2.2.15 cells transfected with mock plasmids were set to 1.0 and results relative to the housekeeping gene GAPDH. E, HepG2 cells were co-transfected with the IP-10 promoter luciferase reporter vector and different HBV protein-expressing vectors, respectively. Relative luciferase activity was determined by standard procedures. The luciferase activity of the mock pCMV-tag group was designated as 1.00. F, HepG2 cells were co-transfected with different doses of HBx-expressing vector and the reporter vector. 48 h later, relative luciferase activity was determined. G, HepG2 cells were transfected with different doses of pCMV-HBx-FLAG, in which the sequence for the FLAG epitope (DYKDDDDK) was tagged to the 3′ end of the HBx sequence, and the sequence of HBx-FLAG was inserted into the pCMV-tag2 vector. The increased protein levels of HBx were determined by Western blot with anti-FLAG antibody (Sigma).
FIGURE 3.
FIGURE 3.
The κB site in the IP-10 promoter involved in HBx-induced IP-10 expression. A, potential binding sites for cis-acting elements in the 5′-flanking region of the human IP-10 gene are shown. Gene2Promoter software revealed several transcription factor binding sites, including NF-κB, ISRE, and GAS. The transcription start site and translation start site are also indicated in the figure. B, effect of HBx protein on the truncated IP-10 promoter constructs. HepG2 cells were co-transfected with serial truncated IP-10 promoter constructs and pCMV-HBx, and relative luciferase activity was determined. The schematic constructs shown (left) and the bar graphs are the relative levels of luciferase activity in each of the transfected samples (right). C, effect of mutated κB sites on activity of the IP-10 promoter. HepG2 cells were co-transfected with pCMV-HBx and the construct with mutated to NF-κB1 or NF-κB2 sites. The relative luciferase activity was determined. D, NF-κB activity was necessary for HBx-induced IP-10 expression. HepG2 cells were co-transfected with pCMV-HBx and the reporter vector following treatment with the NF-κB inhibitor SN50 at different concentrations as indicated. After 48 h, luciferase activity was measured. Results are mean ± S.D. of three experiments performed duplicate. Error bars represent S.D.
FIGURE 4.
FIGURE 4.
NF-κB subunits bind to the IP-10 promoter directly. A, EMSA showed direct binding of NF-κB to the NF-κB1 site of the IP-10 promoter. HepG2 cells were transfected with pCMV-HBx or mock plasmids for 48 h. Nuclear extracts were subjected to EMSA with biotin-labeled κB1 or κB2 oligonucleotides in the absence and presence of the indicated folds of unlabeled competitors or unlabeled mutated competitors. In addition, the NF-κB inhibitor SN50 was involved in the indicated case. B, the CHIP assay showed direct binding of p65 and p50 to the IP-10 promoter. Amplification of a 177-bp DNA fragment containing the NF-κB1 site in the IP-10 promoter and the input DNA are shown.
FIGURE 5.
FIGURE 5.
HBx protein induces the translocation of NF-κB subunits. A, HepG2 cells were transfected with HBx plasmids or co-transfected with HBx plasmids and TRAF2 or TAK1 siRNA for 48 h. Cells were then fixed, permeabilized, and stained with anti-p65 antibody followed by incubation with fluorescein isothiocyanate-conjugated goat anti-rabbit secondary antibody. Nuclei were counterstained with 4′,6-diamidino-2-phenylindole, and immunofluorescence was monitored by confocal microscopy. B, the levels of ectopic HBx protein in cells transfected with pCMV-HBx-FLAG are shown by Western blot using the anti-FLAG antibody. The levels TRAF2 and TAK1 in cells transfected with the respective siRNA and controls are also shown by Western blots using the anti-TRAF2 antibody or anti-TAK1 antibody. C, levels of cytosolic and nuclear p65 protein were determined at the indicated times by Western blot using anti-p65 antibody after transfection with pCMV-HBx. DAPI, 4′,6-diamidino-2-phenylindole.
FIGURE 6.
FIGURE 6.
NF-κB subunits increase the IP-10 expression. A, HepG2 cells were transfected with p65 and/or p50 expression constructs. IP-10 protein levels in the supernatants were measured by the ELISA kit. Results are mean ± S.D. of three experiments performed in duplicate. B, HepG2 cells were co-transfected with (−534/+97) IP-10 or NFB1 Mut reporter constructs and p65 or p50 expression constructs, respectively. After 48 h, luciferase activity was measured. The luciferase activity of the cells co-transfected with pCMV-tag2 and the indicated reporter plasmids was set to 1.00, respectively. Results are mean ± S.D. of three experiments performed in duplicate. Error bars represent S.D. *, a statistically significant difference from mock plasmids (p < 0.05). **, a statistically significant difference from mock plasmids (p < 0.01).
FIGURE 7.
FIGURE 7.
TRAF2/TAK1/NF-κB signaling pathway is involved in HBx-induced IP-10 expression. A, HepG2 cells were transfected with HBx expression plasmids or mock plasmids. After 48 h, phosphorylation of TAK1 and IKKα was detected by Western blot. HepG2 cells stimulated with 100 ng/ml of lipopolysaccharide (LPS) for 30 min were used as positive control. B, semi-quantitative analysis of p-TAK1 and p-IKKα protein levels was performed by Band-Scan software 5.0, and expression of β-actin was used as control. This quantitative analysis represented the respective Western blot of the above (A). C, HepG2 cells were co-transfected with NF-κB or IP-10 promoter luciferase reporter plasmids and HBx expression plasmids or mock plasmids with or without the TAK1-specific inhibitor (5Z)-7-Oxozeaenol (50 nm). After 48 h, luciferase activity was measured. HepG2 cells stimulated with 100 ng/ml of LPS for 30 min were used as positive control. The luciferase activity of the cells co-transfected with mock plasmids pCMV-tag2 and the indicated report plasmids was set to 1.00, respectively. D and E, the knockdown of TAK1 and TRAF2 genes. HepG2 cells were co-transfected with the HBx expression plasmid and TAK1 or TRAF2 siRNA for 48 h. The protein levels of TAK1 and TRAF2 were analyzed by Western blot, respectively (D), and quantified with Band-Scan software 5.0 against the internal control β-actin (E). F, HBx-expressing HepG2 cells were co-transfected with NF-κB or IP-10 promoter luciferase reporter plasmids and TAK1 siRNA or TRAF2 siRNA. 48 h later, luciferase activity was measured. The luciferase activity of cells co-transfected with mock siRNA and the indicated report plasmids was set to 1.00. In C and F, results are mean ± S.D. of three experiments performed in duplicate. Error bars represent S.D. *, p < 0.05, compared with mock plasmids. **, p < 0.01, compared with mock plasmids.
FIGURE 8.
FIGURE 8.
HBx-induced IP-10 expression increases the chemotaxis. Supernatants from HepG2 cells transfected with the indicated plasmid cells were added to the lower chamber of transwell plates, and PBLs were placed in the upper chamber. The lower chamber was in the presence of neutralizing anti-IP-10 antibody or control antibody. After a 4-h incubation, the number of migrated cells was counted in three randomly selected fields per well. Recombinant IP-10 (10 ng/ml) and antibody alone (10 μg/ml) were used as positive and negative controls, respectively. The number of migrated cells in response to supernatants from HepG2 cells transfected with the pCMV-tag was set to 100%. Results are mean ± S.D. of three experiments performed in duplicate. *, a statistically significant difference from mock plasmids (p < 0.05). Error bars represent S.D. **, a statistically significant difference from mock plasmids (p < 0.01).

Similar articles

Cited by

References

    1. Chisari F. V., Ferrari C. (1995) Annu. Rev. Immunol. 13, 29–60 - PubMed
    1. Tiollais P., Charnay P., Vyas G. N. (1981) Science 213, 406–411 - PubMed
    1. Luster A. D., Wang J., Zhao J. H., Wang P. P., Xiang G. J., Lee Y. H., Yun Y., Doria M., Klein N., Lucito R., Schneider R. J. (1998) N. Engl. J. Med. 338, 436–445 - PubMed
    1. Rossi D., Zlotnik A. (2000) Annu. Rev. Immunol. 18, 217–242 - PubMed
    1. Narumi S., Tominaga Y., Tamaru M., Shimai S., Okumura H., Nishioji K., Itoh Y., Okanoue T. (1997) J. Immunol. 158, 5536–5544 - PubMed

Publication types

MeSH terms