Reduction in synaptic GABA release contributes to target-selective elevation of PVN neuronal activity in rats with myocardial infarction
- PMID: 20164200
- PMCID: PMC2904143
- DOI: 10.1152/ajpregu.00391.2009
Reduction in synaptic GABA release contributes to target-selective elevation of PVN neuronal activity in rats with myocardial infarction
Abstract
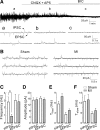
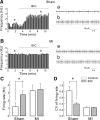
Neuronal activity in the paraventricular nucleus (PVN) is known to be elevated in rats with heart failure. However, the type of neurons involved and the underlying synaptic mechanisms remain unknown. Here we examined spontaneous firing activity and synaptic currents in presympathetic PVN neurons in rats with myocardial infarction (MI), using slice patch clamp combined with the retrograde labeling technique. In PVN neurons projecting to the rostral ventrolateral medulla (PVN-RVLM), MI induced a significant increase in basal firing rate (1.79 to 3.02 Hz, P < 0.05) and a reduction in the frequency of spontaneous (P < 0.05) and miniature (P < 0.01) inhibitory postsynaptic currents (IPSCs). In addition, MI induced an increase in the paired-pulse ratio of evoked IPSCs (P < 0.05). Bicuculline, a GABA(A) receptor antagonist, increased the firing rate of PVN-RVLM neurons in sham-operated (1.21 to 2.74 Hz, P < 0.05) but not MI (P > 0.05) rats. In contrast, in PVN neurons projecting to the intermediolateral horn of the spinal cord (PVN-IML), MI did not induce any significant changes in the basal firing rate and the properties of spontaneous and miniature IPSCs. The properties of spontaneous excitatory postsynaptic currents (EPSCs) were not altered in either neuron group. In conclusion, our results indicate that MI induces an elevation of firing activity in PVN-RVLM but not in PVN-IML neurons and that the elevated firing rate is largely due to a decrease in GABA release. These results provide evidence for a novel target-selective synaptic plasticity in the PVN that is associated with the sympathetic hyperactivity commonly seen in heart failure.
Figures


Similar articles
-
Angiotensin II attenuates synaptic GABA release and excites paraventricular-rostral ventrolateral medulla output neurons.J Pharmacol Exp Ther. 2005 Jun;313(3):1035-45. doi: 10.1124/jpet.104.082495. Epub 2005 Jan 28. J Pharmacol Exp Ther. 2005. PMID: 15681656
-
Benzodiazepine inhibits hypothalamic presympathetic neurons by potentiation of GABAergic synaptic input.Neuropharmacology. 2007 Feb;52(2):467-75. doi: 10.1016/j.neuropharm.2006.08.024. Epub 2006 Oct 10. Neuropharmacology. 2007. PMID: 17045312
-
Enhanced astroglial GABA uptake attenuates tonic GABAA inhibition of the presympathetic hypothalamic paraventricular nucleus neurons in heart failure.J Neurophysiol. 2015 Aug;114(2):914-26. doi: 10.1152/jn.00080.2015. Epub 2015 Jun 10. J Neurophysiol. 2015. PMID: 26063771 Free PMC article.
-
Dual GABAA receptor-mediated inhibition in rat presympathetic paraventricular nucleus neurons.J Physiol. 2007 Jul 15;582(Pt 2):539-51. doi: 10.1113/jphysiol.2007.133223. Epub 2007 May 10. J Physiol. 2007. PMID: 17495040 Free PMC article.
-
Modulation of cardiorespiratory function mediated by the paraventricular nucleus.Respir Physiol Neurobiol. 2010 Nov 30;174(1-2):55-64. doi: 10.1016/j.resp.2010.08.001. Epub 2010 Aug 11. Respir Physiol Neurobiol. 2010. PMID: 20708107 Free PMC article. Review.
Cited by
-
Neuroendocrine-autonomic integration in the paraventricular nucleus: novel roles for dendritically released neuropeptides.J Neuroendocrinol. 2015 Jun;27(6):487-97. doi: 10.1111/jne.12252. J Neuroendocrinol. 2015. PMID: 25546497 Free PMC article. Review.
-
Inhibitory-excitatory synaptic balance is shifted toward increased excitation in magnocellular neurosecretory cells of heart failure rats.J Neurophysiol. 2011 Sep;106(3):1545-57. doi: 10.1152/jn.00218.2011. Epub 2011 Jun 22. J Neurophysiol. 2011. PMID: 21697450 Free PMC article.
-
Comparison of electrophysiological properties of two types of pre-sympathetic neurons intermingled in the hypothalamic paraventricular nucleus.J Vet Sci. 2018 Jul 31;19(4):483-491. doi: 10.4142/jvs.2018.19.4.483. J Vet Sci. 2018. PMID: 29649859 Free PMC article.
-
TEA-sensitive currents contribute to membrane potential of organ surface primo-node cells in rats.J Membr Biol. 2011 Feb;239(3):167-75. doi: 10.1007/s00232-010-9335-5. Epub 2010 Dec 14. J Membr Biol. 2011. PMID: 21153632
-
Experimental heart failure causes depression-like behavior together with differential regulation of inflammatory and structural genes in the brain.Front Behav Neurosci. 2014 Oct 31;8:376. doi: 10.3389/fnbeh.2014.00376. eCollection 2014. Front Behav Neurosci. 2014. PMID: 25400562 Free PMC article.
References
-
- Ahn D, Cheng L, Moon C, Spurgeon H, Lakatta EG, Talan MI. Induction of myocardial infarcts of a predictable size and location by branch pattern probability-assisted coronary ligation in C57BL/6 mice. Am J Physiol Heart Circ Physiol 286: H1201–H1207, 2004 - PubMed
-
- Anderson E, Sinkey C, Lawton W, Mark A. Elevated sympathetic nerve activity in borderline hypertensive humans. Evidence from direct intraneural recordings. Hypertension 14: 177–183, 1989 - PubMed
-
- Bali B, Erdelyi F, Szab Go, Kovacs KJ. Visualization of stress-responsive inhibitory circuits in the GAD65-eGFP transgenic mice. Neurosci Lett 380: 60–65, 2005 - PubMed
-
- Barres CP, Lewis SJ, Grosskreutz CL, Varner KJ, Brody MJ. Role of renal nerves in experimental hypertension: evaluation of neurogenic mechanisms. Clin Exp Hypertens A 11: 117–124, 1989 - PubMed
Publication types
MeSH terms
Substances
Grants and funding
LinkOut - more resources
Full Text Sources

