

T-cell correlates of vaccine efficacy after a heterologous simian immunodeficiency virus challenge
- PMID: 20164222
- PMCID: PMC2863752
- DOI: 10.1128/JVI.02365-09
T-cell correlates of vaccine efficacy after a heterologous simian immunodeficiency virus challenge
Abstract
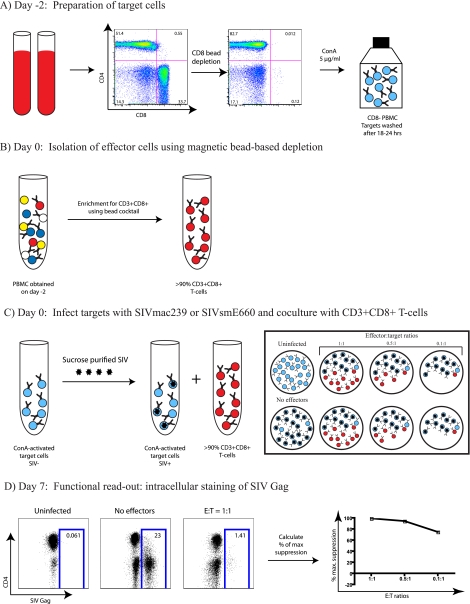
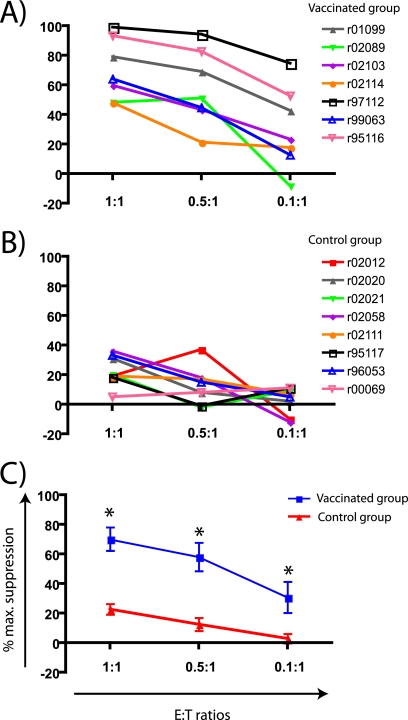
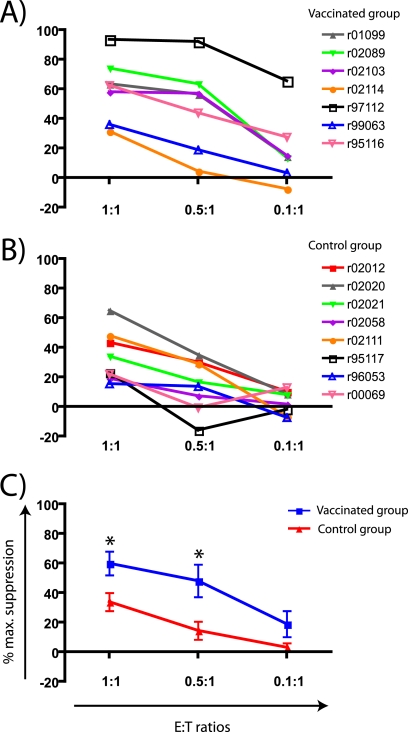
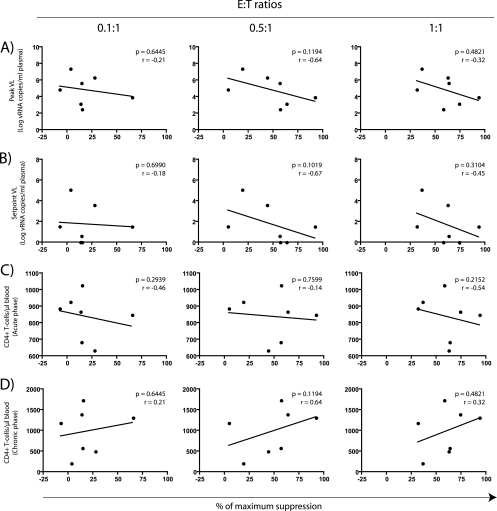
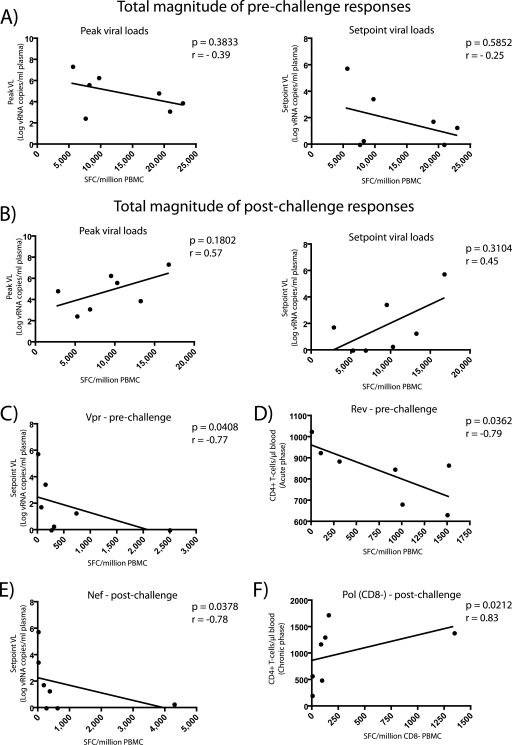
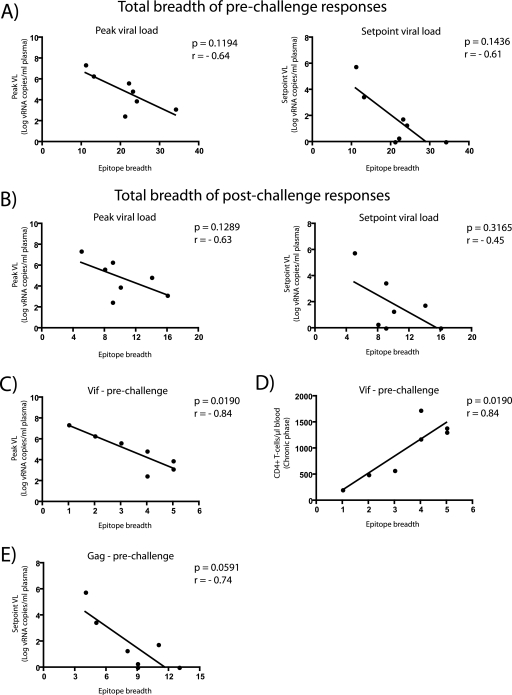
Determining the "correlates of protection" is one of the challenges in human immunodeficiency virus vaccine design. To date, T-cell-based AIDS vaccines have been evaluated with validated techniques that measure the number of CD8(+) T cells in the blood that secrete cytokines, mainly gamma interferon (IFN-gamma), in response to synthetic peptides. Despite providing accurate and reproducible measurements of immunogenicity, these methods do not directly assess antiviral function and thus may not identify protective CD8(+) T-cell responses. To better understand the correlates of vaccine efficacy, we analyzed the immune responses elicited by a successful T-cell-based vaccine against a heterologous simian immunodeficiency virus challenge. We searched for correlates of protection using a viral suppression assay (VSA) and an IFN-gamma enzyme-linked immunospot assay. While the VSA measured in vitro suppression, it did not predict the outcome of the vaccine trial. However, we found several aspects of the vaccine-induced T-cell response that were associated with improved outcome after challenge. Of note, broad vaccine-induced prechallenge T-cell responses directed against Gag and Vif correlated with lower viral loads and higher CD4(+) lymphocyte counts. These results may be relevant for the development of T-cell-based AIDS vaccines since they indicate that broad epitope-specific repertoires elicited by vaccination might serve as a correlate of vaccine efficacy. Furthermore, the present study demonstrates that certain viral proteins may be more effective than others as vaccine immunogens.
Figures
Similar articles
-
The antiviral efficacy of simian immunodeficiency virus-specific CD8+ T cells is unrelated to epitope specificity and is abrogated by viral escape.J Virol. 2007 Mar;81(6):2624-34. doi: 10.1128/JVI.01912-06. Epub 2006 Dec 27. J Virol. 2007. PMID: 17192314 Free PMC article.
-
A replication competent adenovirus 5 host range mutant-simian immunodeficiency virus (SIV) recombinant priming/subunit protein boosting vaccine regimen induces broad, persistent SIV-specific cellular immunity to dominant and subdominant epitopes in Mamu-A*01 rhesus macaques.J Immunol. 2003 Apr 15;170(8):4281-9. doi: 10.4049/jimmunol.170.8.4281. J Immunol. 2003. PMID: 12682263
-
Therapeutic vaccine-mediated Gag-specific CD8+ T-cell induction under anti-retroviral therapy augments anti-virus efficacy of CD8+ cells in simian immunodeficiency virus-infected macaques.Sci Rep. 2020 Jul 9;10(1):11394. doi: 10.1038/s41598-020-68267-w. Sci Rep. 2020. PMID: 32647227 Free PMC article.
-
Vaccination of Macaques with DNA Followed by Adenoviral Vectors Encoding Simian Immunodeficiency Virus (SIV) Gag Alone Delays Infection by Repeated Mucosal Challenge with SIV.J Virol. 2019 Oct 15;93(21):e00606-19. doi: 10.1128/JVI.00606-19. Print 2019 Nov 1. J Virol. 2019. PMID: 31413132 Free PMC article.
-
Pushing the frontiers of T-cell vaccines: accurate measurement of human T-cell responses.Expert Rev Vaccines. 2012 Dec;11(12):1459-70. doi: 10.1586/erv.12.125. Expert Rev Vaccines. 2012. PMID: 23252389 Free PMC article. Review.
Cited by
-
Relevance of long-lived CD8(+) T effector memory cells for protective immunity elicited by heterologous prime-boost vaccination.Front Immunol. 2012 Dec 4;3:358. doi: 10.3389/fimmu.2012.00358. eCollection 2012. Front Immunol. 2012. PMID: 23264773 Free PMC article.
-
Mucosal B Cells Are Associated with Delayed SIV Acquisition in Vaccinated Female but Not Male Rhesus Macaques Following SIVmac251 Rectal Challenge.PLoS Pathog. 2015 Aug 12;11(8):e1005101. doi: 10.1371/journal.ppat.1005101. eCollection 2015 Aug. PLoS Pathog. 2015. PMID: 26267144 Free PMC article.
-
Induction of Potent and Long-Lived Antibody and Cellular Immune Responses in the Genitorectal Mucosa Could be the Critical Determinant of HIV Vaccine Efficacy.Front Immunol. 2014 May 8;5:202. doi: 10.3389/fimmu.2014.00202. eCollection 2014. Front Immunol. 2014. PMID: 24847327 Free PMC article. Review.
-
A vaccine encoding conserved promiscuous HIV CD4 epitopes induces broad T cell responses in mice transgenic to multiple common HLA class II molecules.PLoS One. 2010 Jun 11;5(6):e11072. doi: 10.1371/journal.pone.0011072. PLoS One. 2010. PMID: 20552033 Free PMC article.
-
DNA/Ad5 vaccination with SIV epitopes induced epitope-specific CD4⁺ T cells, but few subdominant epitope-specific CD8⁺ T cells.Vaccine. 2011 Oct 6;29(43):7483-90. doi: 10.1016/j.vaccine.2011.07.048. Epub 2011 Aug 10. Vaccine. 2011. PMID: 21839132 Free PMC article.
References
-
- Addo, M. M., X. G. Yu, A. Rathod, D. Cohen, R. L. Eldridge, D. Strick, M. N. Johnston, C. Corcoran, A. G. Wurcel, C. A. Fitzpatrick, M. E. Feeney, W. R. Rodriguez, N. Basgoz, R. Draenert, D. R. Stone, C. Brander, P. J. Goulder, E. S. Rosenberg, M. Altfeld, and B. D. Walker. 2003. Comprehensive epitope analysis of human immunodeficiency virus type 1 (HIV-1)-specific T-cell responses directed against the entire expressed HIV-1 genome demonstrate broadly directed responses, but no correlation to viral load. J. Virol. 77:2081-2092. - PMC - PubMed
-
- Allen, T. M., M. Altfeld, S. C. Geer, E. T. Kalife, C. Moore, K. M. O'sullivan, I. Desouza, M. E. Feeney, R. L. Eldridge, E. L. Maier, D. E. Kaufmann, M. P. Lahaie, L. Reyor, G. Tanzi, M. N. Johnston, C. Brander, R. Draenert, J. K. Rockstroh, H. Jessen, E. S. Rosenberg, S. A. Mallal, and B. D. Walker. 2005. Selective escape from CD8+ T-cell responses represents a major driving force of human immunodeficiency virus type 1 (HIV-1) sequence diversity and reveals constraints on HIV-1 evolution. J. Virol. 79:13239-13249. - PMC - PubMed
-
- Altfeld, M., M. M. Addo, R. L. Eldridge, X. G. Yu, S. Thomas, A. Khatri, D. Strick, M. N. Phillips, G. B. Cohen, S. A. Islam, S. A. Kalams, C. Brander, P. J. Goulder, E. S. Rosenberg, and B. D. Walker. 2001. Vpr is preferentially targeted by CTL during HIV-1 infection. J. Immunol. 167:2743-2752. - PubMed
-
- Appay, V., D. C. Douek, and D. A. Price. 2008. CD8+ T-cell efficacy in vaccination and disease. Nat. Med. 14:623-628. - PubMed
-
- Belyakov, I. M., and J. D. Ahlers. 2008. Functional CD8+ CTLs in mucosal sites and HIV infection: moving forward toward a mucosal AIDS vaccine. Trends Immunol. 29:574-585. - PubMed
Publication types
MeSH terms
Substances
Grants and funding
- R37 AI052056/AI/NIAID NIH HHS/United States
- RR020141-01/RR/NCRR NIH HHS/United States
- R24 RR016038/RR/NCRR NIH HHS/United States
- 266200400088C/PHS HHS/United States
- R21 AI077472/AI/NIAID NIH HHS/United States
- R24 RR015371/RR/NCRR NIH HHS/United States
- C06 RR020141/RR/NCRR NIH HHS/United States
- C06 RR015459/RR/NCRR NIH HHS/United States
- P51 RR000167/RR/NCRR NIH HHS/United States
- RR15459-01/RR/NCRR NIH HHS/United States
- R01 AI076114/AI/NIAID NIH HHS/United States
- R01 AI049120/AI/NIAID NIH HHS/United States
LinkOut - more resources
Full Text Sources
Other Literature Sources
Research Materials
