. 2010 May;84(9):4366-82.
doi: 10.1128/JVI.01940-09. Epub 2010 Feb 17.

Reciprocal regulation of AKT and MAP kinase dictates virus-host cell fusion

Affiliations

Reciprocal regulation of AKT and MAP kinase dictates virus-host cell fusion

Nishi R Sharma et al. J Virol. 2010 May.

Abstract

Viruses of the Paramyxoviridae family bind to their host cells by using hemagglutinin-neuraminidase (HN), which enhances fusion protein (F)-mediated membrane fusion. Although respiratory syncytial virus and parainfluenza virus 5 of this family are suggested to trigger host cell signaling during infection, the virus-induced intracellular signals dictating virus-cell fusion await elucidation. Using an F- or HN-F-containing reconstituted envelope of Sendai virus, another paramyxovirus, we revealed the role and regulation of AKT1 and Raf/MEK/ERK cascades during viral fusion with liver cells. Our observation that extracellular signal-regulated kinase (ERK) activation promotes viral fusion via ezrin-mediated cytoskeletal rearrangements, whereas AKT1 attenuates fusion by promoting phosphorylation of F protein, indicates a counteractive regulation of viral fusion by reciprocal activation of AKT1 and mitogen-activated protein kinase (MAPK) cascades, establishing a novel conceptual framework for a therapeutic strategy.


Figures
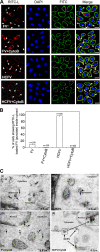
FIG. 1.
FIG. 1.
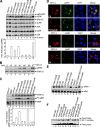
Fusion-mediated cytosolic delivery of RITC-L. (A) FV (80 μg)-HepG2 cell fusion was monitored by RITC-L delivery into the cytosol, using confocal microscopy as described in Materials and Methods. Cells appeared red (diffused fluorescence) after fusion with FV. Nuclei (blue) were visualized by staining with DAPI. The plasma membrane appeared green by development with a FITC-labeled secondary antibody. CytoB and HCFV stand for cytochalasin B-pretreated HepG2 cells and heat-inactivated FV, respectively. Arrowheads indicate representative areas of RITC-L localization (punctate fluorescence) as a result of endocytosis, while plasma membrane-bound FVs are shown by tailed arrows. Images shown are typical examples from more than three experiments. Bars, 23.81 μm. (B) Graphical representation (expressed as mean ± standard deviation [SD]) showing the percentage of RITC-L FVs inside the cytosol for FV and HCFV, with and without cytoB, as quantified after viewing 100 fields during acquisition of confocal images. (C) Immuno-TEM localization of RITC-L during interaction of FV with HepG2 cells. HepG2 cells fused with FV (80 μg) were labeled first with anti-lysozyme rabbit antibodies and then with 15-nm-gold-particle-labeled anti-rabbit IgG antibodies. (a) Cytosolic and vesicular labeling of gold particles to ensure fusion of FVs in the absence of cytoB, showing both fusion and endocytosis. (b) Localization of gold particles in the cytosol, depicting fusion of FVs in the presence of cytoB. (c) Vesicles showing the endocytosis of heat-inactivated FVs. (d) Heat-inactivated FVs (HCFVs) were bound (four particles) to the plasma membrane in the presence of cytoB. (e) Magnified view of the bound HCFVs in panel d, showing the labeling of gold particles. Images are typical of three experiments. The arrows indicate representative areas of RITC-L localization.
FIG. 2.
FIG. 2.
Membrane fusion-associated activation of ERK in HepG2 cells. (A) Probing of fusion-associated MAPK pathways. After FV-, HCFV-, or HNFV-HepG2 cell fusion (dose dependent) under the indicated conditions, lysates were probed with anti-pERK, -pJNK, or -pp38 in Western blots, followed by stripping and reprobing with anti-ERK, -JNK, or -p38, respectively. The amount of lysate loaded is indicated. Relative fold activation (expressed as mean ± SD for three independent experiments) is represented graphically (densitometric analysis). (B) Kinetic profile of ERK activation during FV-HepG2 cell fusion upon incubation with 80 μg FV. (C) Assessment of functional activity of activated ERKs. The indicated lysates (from panel A) were assayed for MBP phosphorylation. Reaction mixtures were resolved by SDS-15% PAGE. The lower half of the gel was autoradiographed (middle panel) after CB staining (lower panel), and the upper half was incubated with anti-ERK to ensure equal loading (upper panel). The graph indicates fold activation (expressed as mean ± SD for three independent experiments) of MBP phosphorylation (lanes 3 to 10). MBP bands were excised and radioactivity was measured. (D) Detection of pERK, pJNK, and pp38 levels during FV-HepG2 cell fusion. Fused cells were fixed, stained for pERK (rows 1 and 2), pJNK (row 3), or pp38 (row 4) with FITC-labeled secondary antibody (green), and merged with RITC-L (red) delivered to the cytosol after FV fusion. Nuclei were stained with DAPI (blue). Bar, 15.59 μm. (E) Raf-1 activation in cells after fusion with FV, HCFV, HNFV, or (H247A)HNFV was checked by anti-pRaf-1 Western analysis (upper panel), followed by stripping and reprobing with anti-cRaf (lower panel). (F) EMSA was performed with nuclear extracts to detect AP-1 activation. Lane 8 was loaded with a 50-fold molar excess of cold competitor during DNA-protein interaction.
FIG. 3.
FIG. 3.
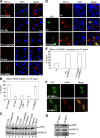
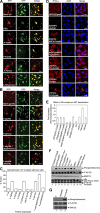
Activation of ERK1 is required for membrane fusion. (A to C) Inhibition of cellular ERKs abrogates fusion. (A) Fusion of 80 μg FV with HepG2 cells pretreated with the MEK-1 inhibitor PD98059 (PD) or transfected with the dominant-negative ERK-1 expression vector (DN) is shown. Note that RITC-L (red) in the cytosol indicates a fusion event. Results are graphically represented in panel B as percentages of fused cells. Error bars indicate SD values for three independent experiments. (C) Corresponding cell lysates were analyzed for pERK levels by Western blotting. The same blot was stripped and reprobed with anti-ERK to ensure equal loading. (D) Constitutively active ERK/MAPK pathway increases RITC-L transfer. The images show fusion of FVs with cells transfected with an expression vector for constitutively active MEK-1 (CA MEK-1, GST tagged). Immunocytochemical analysis shows fused cells stained for GST (green; FITC-labeled secondary antibody) and RITC-L (red) delivered to the cytosol (middle and lower panels). The upper panel represents fusion in nontransfected cells. Results are graphically represented in panel E as percentages of fused cells. Error bars indicate SD values for three independent experiments. (F and G) Effect of constitutively active MEK-1 expression on pERK levels in HepG2 cells. HepG2 cells growing in DMEM were transfected with either wt MEK-1 or CA MEK-1 by use of Lipofectamine reagent. Colocalization of CA MEK-1 (anti-GST and FITC-labeled secondary antibody; green) with increased cellular pERK levels (red) confirms constitutive ERK activation in these cells (lower panel). In the case of wt MEK-1 expression, no such colocalization was observed (upper panel). (G) An immunoblot of lysates from cells transfected with either wt or CA MEK-1 was probed with anti-GST, anti-pERK1/2, and anti-ERK1, as indicated. The same blot was stripped and reprobed. Images were captured by confocal microscopy. Bars, 23.81 μm (A), 15.59 μm (D), and 10 μm (F).
FIG. 4.
FIG. 4.
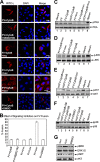
Effects of various signaling inhibitors on membrane fusion. (A) FV-HepG2 cell fusion was evaluated in the presence or absence of p38, PKA, JNK, and AKT inhibitors. (B) Fusion was assayed by cytosolic RITC-L delivery, and the percentage of fused cells is represented graphically. Error bars indicate SD values for three independent experiments. (C to F) Effects of inhibitors were confirmed by Western analysis. (G) Assessment of pERK levels in IAKT-pretreated cells. Lysates from IAKT-pretreated HepG2 cells were probed with anti-pERK, -ERK, -pAKT, and -AKT in the same Western blot after stripping and reprobing, in the order given. Images were captured by confocal microscopy. Bars, 23.81 μm.
FIG. 5.
FIG. 5.
Inhibition of AKT activity enhances membrane fusion. (A to E) Effect of dominant-negative (DNAKT1) and constitutively active (myrAKT1) AKT1 expression on membrane fusion. (A) HepG2 cells transfected with HA-DNAKT1 or Flag-myrAKT1 (pcDNA m2-Myr-AKT) expression vector were allowed to fuse with FV. (B) Percentages of fused cells are represented graphically. Western analyses of lysates from DNAKT1 (C)- and myr-AKT1 (D)-transfected cells are shown. Reprobing with anti-AKT ensured equal loading. (E) Merging of DNAKT1 expression profile with fusion. Immunofluorescence analysis shows HepG2 cells fused with FV and stained for HA-DNAKT1 (HA tag, using FITC-labeled secondary antibodies; green) and RITC-L (red). (F) Effects of AKT and ERK inhibition on kinetics of FV-HepG2 cell fusion. Ten micrograms of NBD-PE-labeled virosomes was incubated with PD98059- or IAKT-pretreated cells (1 × 10⁶) in 1 ml ice-cold DPBS containing 1.5 mM Ca2+. Virosome-cell fusion was recorded as described in the text. Images were captured by confocal microscopy. Bars, 23.81 μm (A) and 15.59 μm (E).
FIG. 6.
FIG. 6.
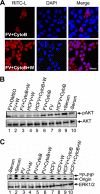
Effect of PI3K inhibition on fusion of FV. (A) Serum-starved HepG2 cells were pretreated with wortmannin (100 nM) and cytoB (10 μM), followed by 1 h of incubation with 80 μg FV (RITC-L loaded). Images were captured with a confocal microscope. Virosome-cell fusion was assessed by RITC-L delivery into the cytosol. (B) Corresponding cell lysates were subjected to SDS-10% PAGE, followed by Western blotting using anti-phospho-AKT antibody (upper panel). The same blot was stripped and reprobed with anti-AKT antibody (lower panel). (C) HepG2 cells were also assayed for PI3K activity after similar treatments. Cells were lysed and equal amounts of protein (lower panel) were used for immunoprecipitation with mouse monoclonal anti-phosphotyrosine antibodies, and the immunocomplexes were assayed for the ability to phosphorylate PI to PIP as described in the text. Bar, 23.81 μm.
FIG. 7.
FIG. 7.
Motif Scan results for F protein. The F protein sequence (GenBank accession no. BAD 74228) was included in a Motif Scan (http://scansite.mit.edu) search for a candidate AKT kinase site(s). As shown, one site (threonine 234) was identified as a potential site for AKT phosphorylation.
FIG. 8.
FIG. 8.
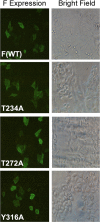
Expression of different F mutants. Cells were transfected with pcDNA 3.1-F plasmid encoding wild-type F or different F mutants (T272A, T234A, or Y316A) as described in Materials and Methods, and F expression was evaluated by immunocytochemistry using anti-F antibody followed by FITC-labeled secondary antibody.
FIG. 9.
FIG. 9.
Mutation of F and HN proteins affects fusion. (A) Cell-cell fusion of different F mutant-expressing cells was monitored by content mixing. Images were captured with an epifluorescence microscope. Cell-cell fusion of cells with HN and wt F cotransfection served as a positive control. (B) Effect of PD98059 or IAKT on cell-cell fusion of cells with both HN and F proteins (first row) and only F protein (second and third rows), determined by overlaying target cells as described in the text. The last two rows indicate the effect of mutation in HN (H247A) on cell-cell fusion in the absence or presence of IAKT pretreatment of overlaid cells. (C) Percent fusion activity was scored relative to wild-type HN fusion activity. Error bars indicate SD values for three independent experiments. (D) Effect of mutation in HN or F on virosome-cell fusion. Virosomes (80 μg) with the indicated mutations in F or HN were tested for fusion with HepG2 cells. The third and fourth rows indicate the effect of mutation in HN (H247A) on virosome-cell fusion in the absence or presence of IAKT pretreatment. (E) Cell lysates (from panel D) were probed with anti-pAKT and anti-AKT in Western blots and graphically represented to show the effect of HN contact on AKT activity. (F) AKT phosphorylates F protein. The indicated virosomes were fused with cytoB- and/or IAKT-pretreated HepG2 cells. Anti-F (lanes 1 to 7 and 9) and anti-Sendai virus (lane 8) immunoprecipitates were probed with anti-F, followed by stripping and anti-phosphothreonine Western analysis to detect F phosphorylation (confirmed by a band corresponding to the 45-kDa F1 fragment). The same band showed threonine phosphorylation after immunoblotting with anti-phosphothreonine. The third panel indicates equal loading, and the bottom panel shows Ponceau staining. (G) Phosphorylation of F is fusion dependent. Cells expressing F (wt and T234A mutant; lanes 1 and 2, respectively) were immunoprecipitated with anti-F (middle panel), followed by stripping and immunoblotting by anti-phosphothreonine (top panel) to detect F phosphorylation. FV fused with HepG2 cells served as a positive control for F phosphorylation (lane 3). ERK1/2 served as a loading control (bottom 3). Bars, 100 μm (A and B) and 23.81 μm (D).
FIG. 10.
FIG. 10.
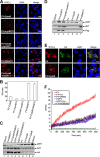
Effect of actin depolymerization on FV-cell fusion. (A) FVs (80 μg) were fused with HepG2 cells pretreated with the indicated doses of cytoB, IAKT, PD98059, and JASP alone or in combination. Fluorescence analysis is shown for fused cells stained for RITC-L (red) and F-actin (green; Bodipy FL-phallacidin). Nuclei were counterstained with DAPI. Tailed arrows and arrowheads represent actin depolymerization and polymerization, respectively, in the case of cytoB (20 μM) and JASP pretreatments. Arrowheads in the red channel in the last row show virosomes bound to the plasma membrane. The phallacidin (M) panels denote magnified images. (B) Percentages of fused cells are represented graphically. Error bars indicate SD values for three independent experiments. (C to E) Ezrin profile during membrane fusion. (C) Ablation of endogenous ezrin inhibits fusion. HepG2 cells were transfected with ezrin-specific siRNA (ezrin siRNA) or control siRNA (NS siRNA), and fusion with FV was analyzed. (D) Levels of phospho-ezrin, ezrin, and ERK (equal loading) were checked in lysates from HepG2 cells with the indicated treatments by Western blotting. (E) Fusion enhances ezrin mRNA levels. RT-PCR analysis of ezrin mRNA from HepG2 cells undergoing the indicated treatments and fusion with FV showed a product of 565 bp for the ezrin gene, which was visualized by ethidium bromide staining. β-Actin was included for normalization (specific 650-bp product). Densitometric quantitation of the bands depicts relative amounts of ezrin mRNA among different samples, with the NS siRNA-treated sample value set at 1. Error bars indicate SD values for three independent experiments. (F) Effect of JASP or PD98059 treatment on kinetics of FV-HepG2 cell fusion. Ten micrograms of NBD-PE-labeled virosomes was incubated with JASP (0.3 μM)- or PD98059 (70 μM)-pretreated HepG2 cells (1 × 10⁶) in 1 ml ice-cold DPBS containing 1.5 mM Ca2+. Virosome-cell fusion was recorded as described in the text. (G) Western profiles (for the cells used for panel F) showing pERK levels in JASP- and PD98059-pretreated HepG2 cells after fusion with FV. Images were captured by confocal microscopy. (H) Effect of JASP on F phosphorylation. Following fusion (in the absence or presence of JASP), FV-HepG2 cell lysates were immunoprecipitated with anti-F (middle panel), followed by immunoblotting with anti-phosphothreonine antibody (top panel) to detect phosphorylation of F protein (lanes 1 and 2). ERK1/2 served as a loading control (bottom panel). Bars, 23.81 μm.
FIG. 11.
FIG. 11.
Effect of fusion on ceramide synthesis and phosphatases. (A) FV or HCFV was incubated with HepG2 cells pretreated with cytoB (10 μM). Lysed cells were subjected to immunoprecipitation with anti-ceramide antibody. Ceramide immunocomplexes were resolved by TLC and visualized by DAB staining. The aligned bar diagram shows fold activation of ceramide synthesis. Error bars indicate SD values for three independent experiments. (B) Lysates prepared from HepG2 cells pretreated with OKA or TAU and fused with FV were used to assess PP2A activity as described in the text, which is expressed as specific activity in the form of a bar diagram, with SD values shown for three independent experiments. (C) Serum-starved HepG2 cells were incubated with 2 nM OKA, 3 nM TAU, or ethanol (EtOH; solvent control) for 1 h, followed by incubation with 80 μg FV. Cells were washed and images were captured by confocal microscopy. Bars, 23.81 μm.
FIG. 12.
FIG. 12.
Model for membrane fusion-induced host cell signaling. The reciprocal relationship between AKT1 and the ERK/MAPK pathway during HNFV-HepG2 cell fusion is simplified in this schematic model. The impairment of AKT activation by HN protein contact with target cells (through terminal sialic acid [TSA] receptors of HepG2 cells) prevents the phosphorylation of F protein and allows complete fusion (hemifusion and core mixing) catalyzed by F protein (with F bound to ASGPR of HepG2 cells). Meanwhile, stress during the hemifusion state (lipid mixing) induces the ERK/MAPK pathway through ceramide synthesis, which in turn supports membrane fusion through ezrin-induced actin depolymerization. Ceramide-activated PP2A seems to lie at the crossing of two opposing pathways, with one supporting the fusion event (Raf/ERK/MAPK) and the other inhibiting it (AKT).

Similar articles

Cited by

References

    1. Andjelkovic, N., S. Zolnierowicz, C. Van Hoof, J. Goris, and B. A. Hemmings. 1996. The catalytic subunit of protein phosphatase 2A associates with the translation termination factor eRF1. EMBO J. 15:7156-7167. - PMC - PubMed
    1. Avota, E., A. Avots, S. Niewiesk, L. P. Kane, U. Bommhardt, V. ter Meulen, and S. Schneider-Schaulies. 2001. Disruption of Akt kinase activation is important for immunosuppression induced by measles virus. Nat. Med. 7:725-731. - PubMed
    1. Bagai, S., A. Puri, R. Blumenthal, and D. P. Sarkar. 1993. Hemagglutinin-neuraminidase enhances F protein-mediated membrane fusion of reconstituted Sendai virus envelopes with cells. J. Virol. 67:3312-3318. - PMC - PubMed
    1. Bagai, S., and D. P. Sarkar. 1994. Fusion-mediated microinjection of lysozyme into HepG2 cells through hemagglutinin neuraminidase-depleted Sendai virus envelopes. J. Biol. Chem. 269:1966-1972. - PubMed
    1. Bitzer, M., U. Lauer, C. Baumann, M. Spiegel, M. Gregor, and W. J. Neubert. 1997. Sendai virus efficiently infects cells via the asialoglycoprotein receptor and requires the presence of cleaved F0 precursor proteins for this alternative route of cell entry. J. Virol. 71:5481-5486. - PMC - PubMed

Publication types