Comparative Study
. 2010 Jul;12(7):664-78.
doi: 10.1093/neuonc/nop075. Epub 2010 Feb 17.

Distinct patterns of 1p and 19q alterations identify subtypes of human gliomas that have different prognoses

Affiliations
Comparative Study

Distinct patterns of 1p and 19q alterations identify subtypes of human gliomas that have different prognoses

Artemis P Vogazianou et al. Neuro Oncol. 2010 Jul.

Abstract

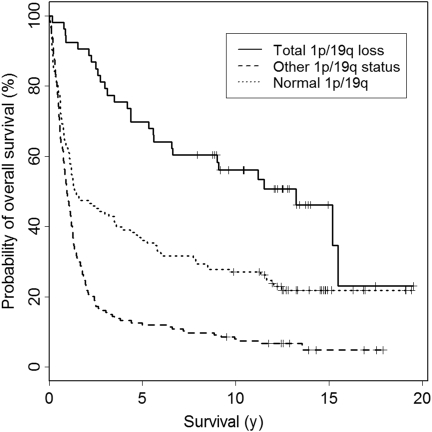
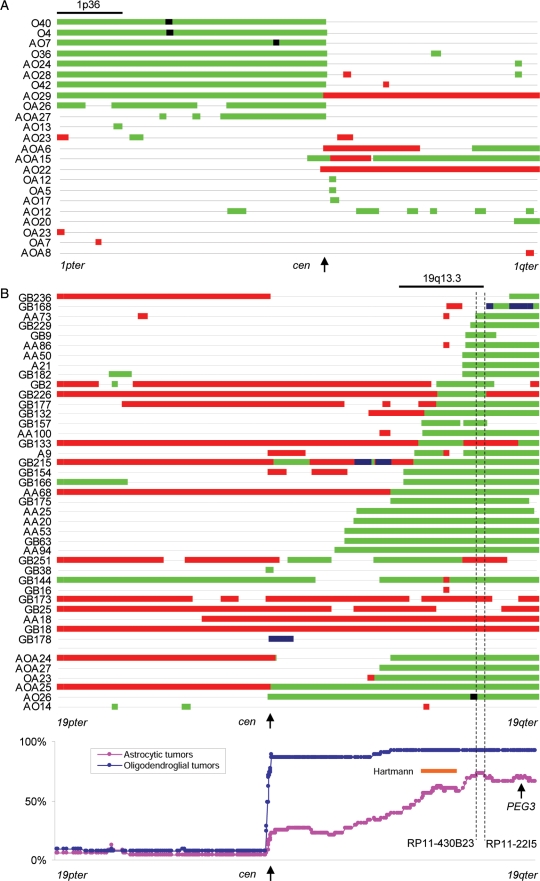
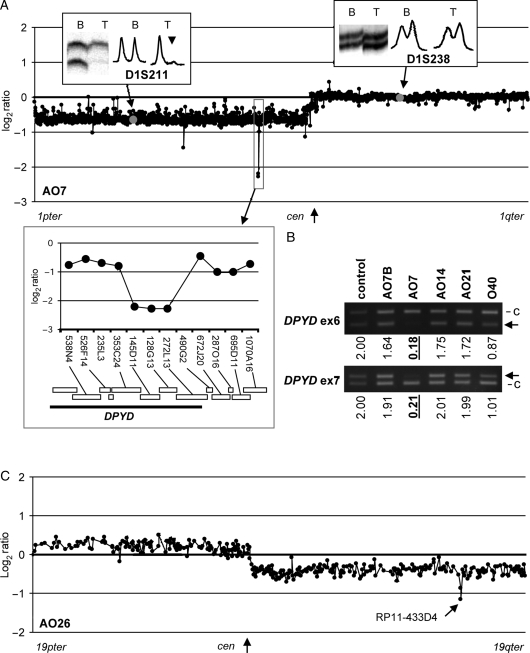
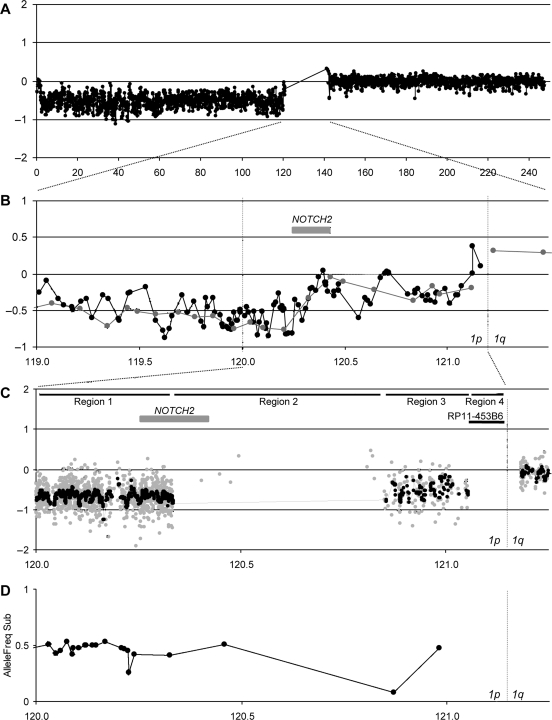
We studied the status of chromosomes 1 and 19 in 363 astrocytic and oligodendroglial tumors. Whereas the predominant pattern of copy number abnormality was a concurrent loss of the entire 1p and 19q regions (total 1p/19q loss) among oligodendroglial tumors and partial deletions of 1p and/or 19q in astrocytic tumors, a subset of apparently astrocytic tumors also had total 1p/19q loss. The presence of total 1p/19q loss was associated with longer survival of patients with all types of adult gliomas independent of age and diagnosis (P = .041). The most commonly deleted region on 19q in astrocytic tumors spans 885 kb in 19q13.33-q13.41, which is telomeric to the previously proposed region. Novel regions of homozygous deletion, including a part of DPYD (1p21.3) or the KLK cluster (19q13.33), were observed in anaplastic oligodendrogliomas. Amplifications encompassing AKT2 (19q13.2) or CCNE1 (19q12) were identified in some glioblastomas. Deletion mapping of the centromeric regions of 1p and 19q in the tumors that had total 1p/19q loss, indicating that the breakpoints lie centromeric to NOTCH2 within the pericentromeric regions of 1p and 19q. Thus, we show that the copy number abnormalities of 1p and 19q in human gliomas are complex and have distinct patterns that are prognostically predictive independent of age and pathological diagnosis. An accurate identification of total 1p/19q loss and discriminating this from other 1p/19q changes is, however, critical when the 1p/19q copy number status is used to stratify patients in clinical trials.


Figures

Fig. 1.
Fig. 1.
A Kaplan–Meier curve for overall survival of all adult (16 years of age or older) glioma patients divided into 3 subgroups according to the chromosome 1 and 19 status (see Results for definition). The survival differences between the 3 subgroups were statistically significant in univariate (P < .001) and multivariate (P = .041) analyses with total 1p/19q loss being associated with the longest survival.
Fig. 2.
Fig. 2.
(A) A diagram of copy number abnormalities on chromosome 1. Tumors with total 1p deletion as a sole chromosome 1 copy number change are not shown. Copy number status is schematically represented along chromosome 1 (1pter on the left to 1qter on the right) by color-coded bars as follows: black, HD; green, hemizygous deletion; red, copy number gain. (B) A diagram of copy number abnormalities on chromosome 19. Monosomy 19, trisomy 19, or tumors with total 19q deletion as the sole chromosome 19 copy number change are not shown. Copy number status is schematically represented along chromosome 19 (19pter on the left to 19qter on the right) by color-coded bars as follows: black, HD; green, hemizygous deletion; red, copy number gain; blue, amplification. The bottom panel shows the incidence of deletion at each clone plotted along chromosome 19 in astrocytic and oligodendroglial tumors. The minimal deleted region suggested by Hartmann et al.7 is indicated by an orange line. The most frequently deleted region in this study is defined as being between RP11-430B23 and RP11-22I5 (indicated by dotted lines).
Fig. 3.
Fig. 3.
(A) A chromosome 1 BAC tile path–array plot of AO7. Results of MSA at 2 markers (D1S211, allelic imbalance indicated by an arrow head; D1S238, allelic balance) are shown in insets. The clones harboring each marker are indicated by gray dots in the plot. The region of HD is indicated by a square and enlarged in inset showing locations of clones and genes (modified after Ensembl Genome Browser, http://www.ensembl.org/ Homo_sapiens). (B) Multiplex PCR at DPYD exons 6 and 7. The band representing the target locus is indicated by an arrow in each panel. c, control locus (WI-3306, see Materials and Methods). Calculated copy numbers (normal = 2) are indicated below each lane. HDs (copy number < 0.6) are indicated by underlines. Control, DNA from normal blood; AO7B, blood DNA from AO7. AO14 and AO21 showed no evidence of deletion at this region in the chromosome 1 tile-path array-CGH, whereas O40 had deletion of 1p. The results consistent with the calculated copy number at these 2 exons. (C) A chromosome 19 BAC tile path–array plot of AO26. The homozygously deleted clone (RP11-433D4) is indicated by an arrow.
Fig. 4.
Fig. 4.
Copy number status of the 1p near-centromeric region in AO28. (A) Chromosome 1 BAC array of AO28 showing total 1p loss (see Results for definition). (B) A combined BAC/fosmid array of the 1p near-centromeric region. The corresponding region of (A) is indicated. Gray dots/line, BAC array; black dots/line, fosmid array. The definitions of the Regions (1–4) are described in the text. The position of NOTCH2 is indicated. (C) A custom oligonucleotide array plot of the 1p near-centromeric region. The corresponding region of (B) is indicated. Gray dots, normalized raw log2 ratio of each probe; black dots/line, the moving median of the normalized raw log2 ratio in a 5-kb window. The positions of NOTCH2 and RP11-453B6 (the most centromeric BACs clone used for FISH, see Fig. 6 and Supplementary Material, Fig. S6) are indicated. (D) The B allele frequency plot of the SNP array for the same region as (C). Allelic imbalance (LOH) appears as inconsistent B allele frequencies (BAFs) between the tumor and constitutional DNA. For the presentation, the absolute values of the difference of the BAFs between the tumor and the matched constitutional DNA are plotted only for the informative loci. The values around 0.5 indicate LOH, whereas those close to 0 indicate retention of heterozygosity. All informative loci except one show LOH in this region.
Fig. 5.
Fig. 5.
Copy number status of the 19q near-centromeric region in AO28. (A) Chromosome 19 BAC array of AO28 showing total 19q loss (see Results for definition). (B) A combined BAC/fosmid array of the 19q near-centromeric region. The corresponding region of (A) is indicated. Gray dots/line, BAC array; black dots/line, fosmid array. The definitions of the Regions (5–6) are described in the text. (C) A custom oligonucleotide array plot of the 19q near-centromeric region. The corresponding region of (B) is indicated. Gray dots, normalized raw log2 ratio of each probe; black dots/line, the moving median of the normalized raw log2 ratio in a 5-kb window. (D) The absolute values of the difference of the B allele frequency between the tumor and the matched constitutional DNA are plotted for the informative loci (see the legend for Fig. 4D). The same region as (C) is shown. All informative loci in the 19q pericentromeric region show LOH, whereas those in the 19p pericentromeric region retained heterozygosity.
Fig. 6.
Fig. 6.
FISH results for AO28. Histograms of signals counted from 100 nuclei for each probe set (shown on the top) are shown.

Similar articles

Cited by

References

    1. Griffin CA, Burger P, Morsberger L, et al. Identification of der(1;19)(q10;p10) in five oligodendrogliomas suggests mechanism of concurrent 1p and 19q loss. J Neuropathol Exp Neurol. 2006;65:988–994. - PubMed
    1. Jenkins RB, Blair H, Ballman KV, et al. A t(1;19)(q10;p10) mediates the combined deletions of 1p and 19q and predicts a better prognosis of patients with oligodendroglioma. Cancer Res. 2006;66:9852–9861. - PubMed
    1. Louis DN, Ohgaki H, Wiestler OD, Cavenee WK. WHO Classification of Tumours of the Central Nervous System. 4th. Lyon, France: International Agency for Research on Cancer; 2007. - PubMed
    1. Cairncross G, Berkey B, Shaw E, et al. Phase III trial of chemotherapy plus radiotherapy compared with radiotherapy alone for pure and mixed anaplastic oligodendroglioma: Intergroup Radiation Therapy Oncology Group Trial 9402. J Clin Oncol. 2006;24:2707–2714. - PubMed
    1. van den Bent MJ, Carpentier AF, Brandes AA, et al. Adjuvant procarbazine, lomustine, and vincristine improves progression-free survival but not overall survival in newly diagnosed anaplastic oligodendrogliomas and oligoastrocytomas: a randomized European Organisation for Research and Treatment of Cancer phase III trial. J Clin Oncol. 2006;24:2715–2722. - PubMed

Publication types