. 2010 Apr;17(4):651-9.
doi: 10.1128/CVI.00494-09. Epub 2010 Feb 17.

Interactive changes between macrophages and adipocytes

Affiliations

Interactive changes between macrophages and adipocytes

Linglin Xie et al. Clin Vaccine Immunol. 2010 Apr.

Abstract

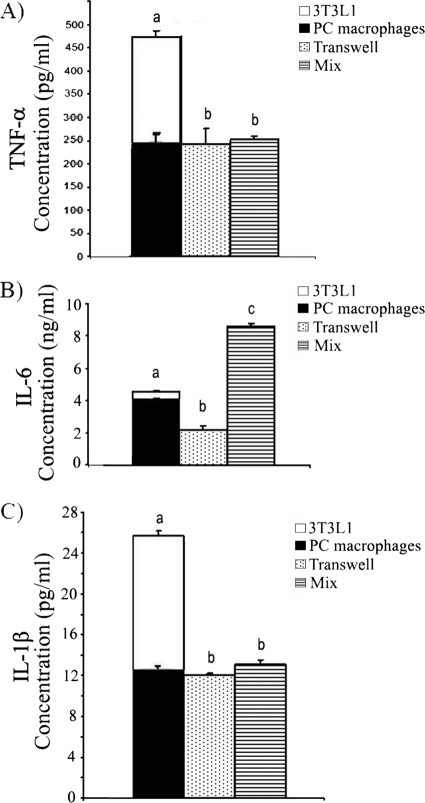
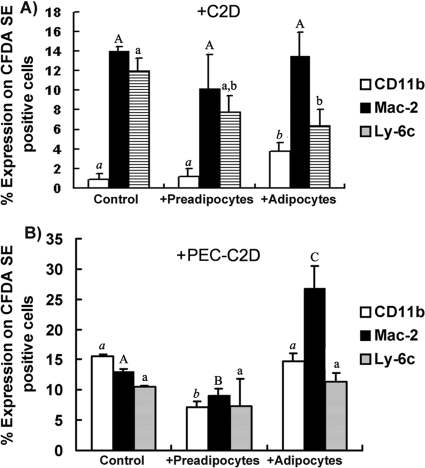
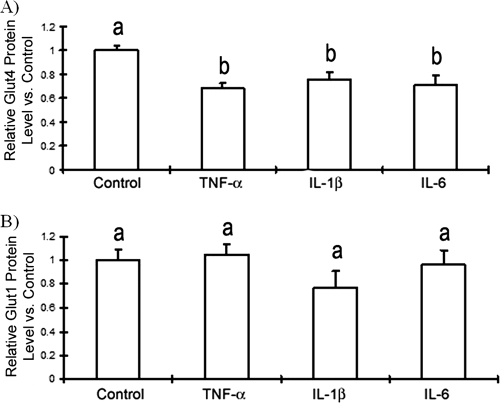
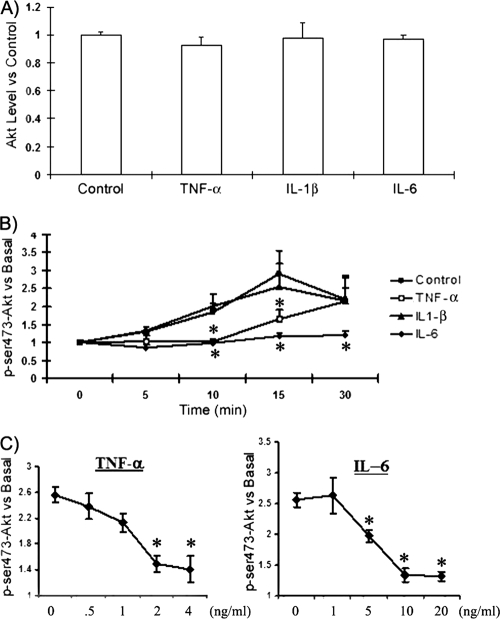
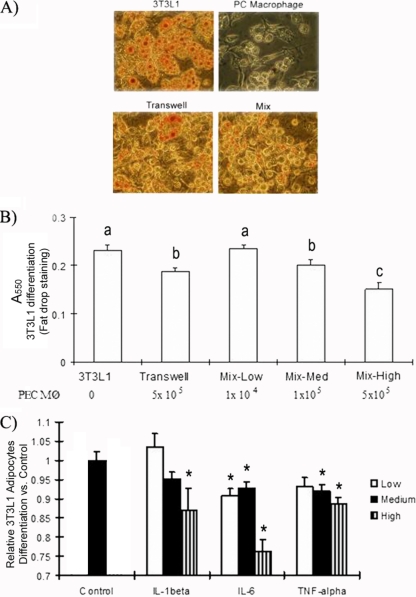
Obesity is associated with a proinflammatory state, with macrophage infiltration into adipose tissue. We tested the hypothesis that communication between macrophages and adipocytes affects insulin resistance by disrupting insulin-stimulated glucose transport, adipocyte differentiation, and macrophage function. To test this hypothesis, we cocultured 3T3-L1 adipocytes with C2D macrophages or primary peritoneal mouse macrophages and examined the impacts of macrophages and adipocytes on each other. Adipocytes and preadipocytes did not affect C2D macrophage TNF-alpha, IL-6, or IL-1beta transcript concentrations relative to those obtained when C2D macrophages were incubated alone. However, preadipocytes and adipocytes increased PEC-C2D macrophage IL-6 transcript levels, while preadipocytes inhibited IL-1beta transcript levels compared to those obtained when PEC-C2D macrophages were incubated in medium alone. We found that adipocyte coculture increased macrophage consumption of tumor necrosis factor alpha (TNF-alpha), interleukin 1beta (IL-1beta), and, in some cases, IL-6. C2D macrophages increasingly downregulated GLUT4 transcript levels in differentiated adipocytes. Recombinant TNF-alpha, IL-1beta, and IL-6 also downregulated GLUT4 transcript levels relative to those for the control. However, only IL-6 was inhibitory at concentrations detected in macrophage-adipocyte cocultures. IL-6 and TNF-alpha, but not IL-1beta, inhibited Akt phosphorylation within 15 min of insulin stimulation, but only IL-6 was inhibitory 30 min after stimulation. Lastly, we found that adipocyte differentiation was inhibited by macrophages or by recombinant TNF-alpha, IL-6, and IL-1beta, with IL-6 having the most impact. These data suggest that the interaction between macrophages and adipocytes is a complex process, and they support the hypothesis that the macrophage-adipocyte interaction affects insulin resistance by disrupting insulin-stimulated glucose transport, adipocyte differentiation, and macrophage function.


Figures

FIG. 1.
FIG. 1.
Secretion of TNF-α, IL-6, and IL-1β in macrophage and 3T3-L1 adipocyte cocultures. 3T3-L1 adipocytes and peritoneal (PC) macrophages were either incubated alone, coincubated directly (mix), or coincubated but separated in transwell plates for 4 days (from day 8 to day 12 in adipocyte medium). Cell-free supernatants were collected, and cytokine concentrations were determined by ELISA. (A) TNF-α; (B) IL-6; (C) IL-1β. The levels of each cytokine in supernatants from cocultures were compared to the sum of the amounts of that cytokine secreted by 3T3-L1 cells and macrophages when they were cultured alone. For this purpose, the bars for 3T3-L1 adipocytes and macrophages are stacked together. The data are presented as means ± standard errors of the means for 3 to 6 independent replicates per treatment. Different letters indicate a significant difference. A P value of < 0.05 was considered significant.
FIG. 2.
FIG. 2.
Percentage of CFDA-SE-positive C2D cells testing positive for a given marker. (A) CFDA-SE-labeled C2D macrophages grown in vitro were either cultured alone or cocultured with adipocytes or with preadipocytes. (B) CFDA-SE-labeled C2D macrophages were adoptively transferred to the peritoneal cavity for 24 h. After peritoneal cavity isolation, PEC-C2D macrophages were either cultured alone or cocultured with 3T3-L1 adipocytes or preadipocytes. Cell mixtures were dispersed with 0.025% EDTA and were resuspended in HBSS buffer. Cells were immunostained for flow cytometry as described in Materials and Methods. The data are presented as means ± standard errors of the means for 3 independent replicates per treatment. Different letters indicate a significant difference. A P value of <0.05 was considered significant.
FIG. 3.
FIG. 3.
Effects of recombinant TNF-α, IL-6, and IL-1β on GLUT4 protein expression. Fully differentiated adipocytes were incubated in medium containing recombinant mouse TNF-α (2 ng/ml), IL-6 (10 ng/ml), or IL-1β (20 ng/ml) for 2 days. Cells were fixed and immunostained for GLUT1 or GLUT4 expression using flow cytometry as described in Materials and Methods. The data are presented as means ± standard errors of the means for 3 to 6 independent replicates per treatment. Different letters indicate a significant difference. A P-value of <0.05 was considered significant.
FIG. 4.
FIG. 4.
TNF-α, IL-6, and IL-1β affect Akt phosphorylation differently. Fully differentiated adipocytes were incubated with or without (control) recombinant mouse TNF-α, IL-6, or IL-1β for 2 days. (A) Total Akt protein levels were detected after treatment with cytokines. Values were normalized to control values, set at 1. (B) Cells were serum starved for 2 h, stimulated with insulin (100 nM) for 20 min, fixed, and assessed for Akt and phosphorylated Akt (p-Akt) by flow cytometry as described in Materials and Methods. p-Akt was detected at 0, 5, 10, 15, or 30 min after insulin stimulation. (C) Fully differentiated adipocytes were incubated in DMEM with 10% fetal bovine serum containing different levels of TNF-α, IL-6, or IL-1β for 2 days. Cells were serum starved for 2 h, stimulated with insulin (100 nM) for 20 min, fixed, and assessed for Akt and p-Akt by flow cytometry. p-Akt was detected at 15 min after insulin stimulation. The data are presented as means ± standard errors of the means for 3 to 6 independent replicates per treatment. An asterisk identifies a significant difference between the control (no cytokine treatment) and the treatment at each time point. A P value of <0.05 was considered significant.
FIG. 5.
FIG. 5.
Effects of TNF-α, IL-6, and IL-1β on 3T3-L1 adipocyte differentiation. 3T3-L1 cells were differentiated for 4 days with thioglycolate-elicited peritoneal macrophages in direct coculture or in transwells. Cells were fixed and stained with Sudan IV dye as described in Materials and Methods. (A) Cells were imaged at ×200 magnification under a light microscope. “Mix” stands for direct coculture. (B) The lipid concentration was determined by measuring the absorbance at 550 nm. The number of PEC-C2D macrophages (Mφ) in each direct coculture is given at the bottom. Different letters indicate a significant difference. (C) 3T3-L1 cells were differentiated for 4 days and were then treated with TNF-α, IL-6, or IL-1β for an additional 4 days. High, medium, and low concentrations of the cytokines were as follows: 2, 1, and 0.5 ng/ml for TNF-α; 20, 10, and 1 ng/ml for IL-1β; and 10, 5, and 2 ng/ml for IL-6. At day 8, cells were fixed and stained with Sudan IV. Differentiation was determined by measuring the absorbance at 550 nm. The data are presented as means ± standard errors of the means for 3 to 6 independent replicates per treatment. An asterisk identifies a significant difference between the control and the treatment at each time point. A P value of <0.05 was considered significant.

References

    1. Ailhaud, G. 2006. Adipose tissue as a secretory organ: from adipogenesis to the metabolic syndrome. C. R. Biol. 329:570-577. - PubMed
    1. Ajuwon, K. M., and M. E. Spurlock. 2005. Adiponectin inhibits LPS-induced NF-κB activation and IL-6 production and increases PPARγ2 expression in adipocytes. Am. J. Physiol. Regul. Integr. Comp. Physiol. 288:R1220-R1225. - PubMed
    1. Beharka, A. A., J. W. Armstrong, and S. K. Chapes. 1998. Macrophage cell lines derived from major histocompatibility complex II-negative mice. In Vitro Cell. Dev. Biol. Anim. 34:499-507. - PubMed
    1. Blüher, M., M. Fasshauer, A. Tonjes, J. Kratzsch, M. R. Schon, and R. Paschke. 2005. Association of interleukin-6, C-reactive protein, interleukin-10 and adiponectin plasma concentrations with measures of obesity, insulin sensitivity and glucose metabolism. Exp. Clin. Endocrinol. Diabetes 113:534-537. - PubMed
    1. Carey, A. L., G. R. Steinberg, S. L. Macaulay, W. G. Thomas, A. G. Holmes, G. Ramm, O. Prelovsek, C. Hohnen-Behrens, M. J. Watt, D. E. James, B. E. Kemp, B. K. Pedersen, and M. A. Febbraio. 2006. Interleukin-6 increases insulin-stimulated glucose disposal in humans and glucose uptake and fatty acid oxidation in vitro via AMP-activated protein kinase. Diabetes 55:2688-2697. - PubMed

Publication types

LinkOut - more resources