. 2010 Feb 17;30(7):2454-63.
doi: 10.1523/JNEUROSCI.5983-09.2010.

Inhibition of FK506 binding proteins reduces alpha-synuclein aggregation and Parkinson's disease-like pathology

Affiliations

Inhibition of FK506 binding proteins reduces alpha-synuclein aggregation and Parkinson's disease-like pathology

Melanie Gerard et al. J Neurosci. .

Abstract

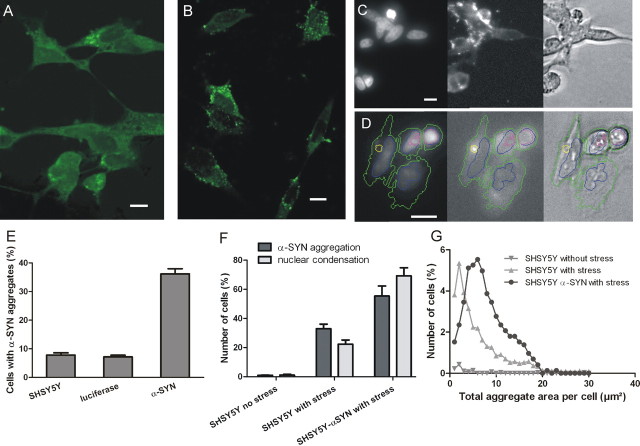
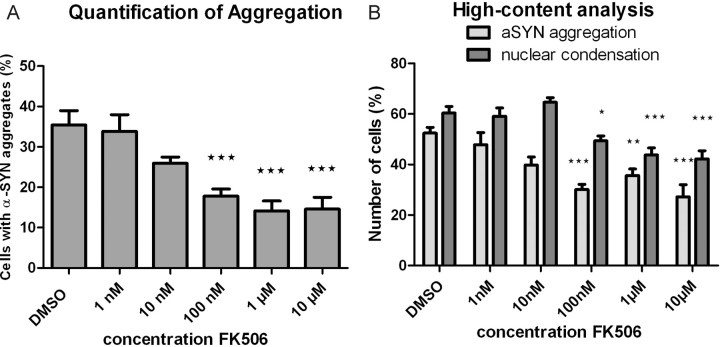
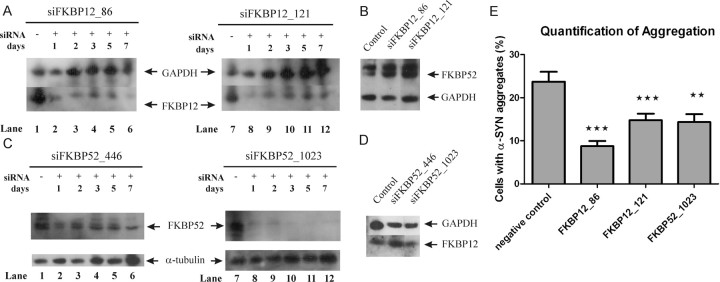
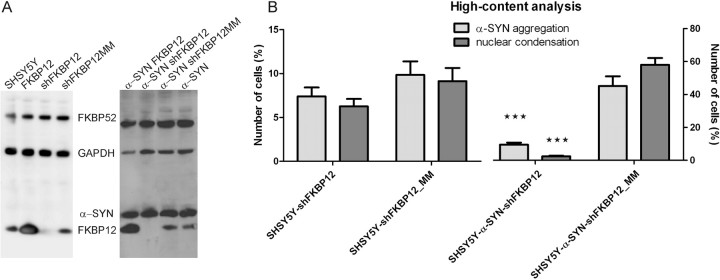
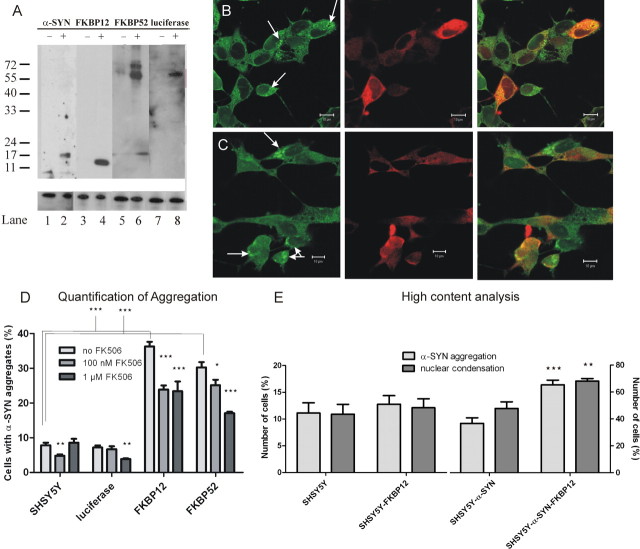
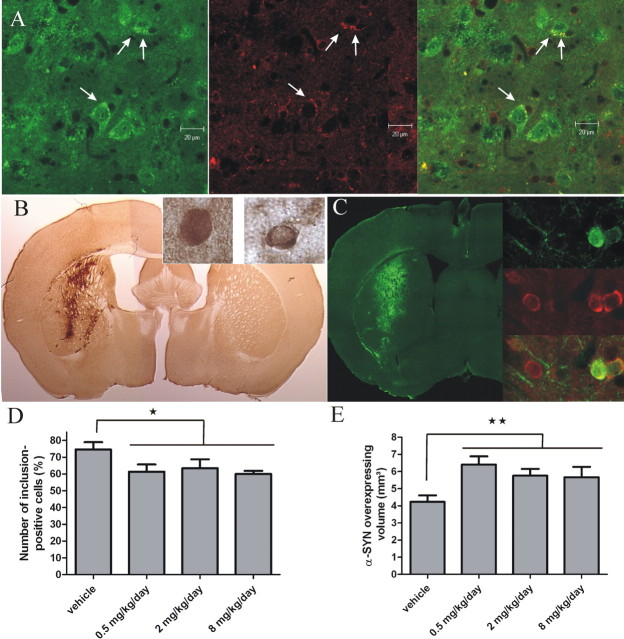
alpha-Synuclein (alpha-SYN) is a key player in the pathogenesis of Parkinson's disease (PD). In pathological conditions, the protein is present in a fibrillar, aggregated form inside cytoplasmic inclusions called Lewy bodies. Members of the FK506 binding protein (FKBP) family are peptidyl-prolyl isomerases that were shown recently to accelerate the aggregation of alpha-SYN in vitro. We now established a neuronal cell culture model for synucleinopathy based on oxidative stress-induced alpha-SYN aggregation and apoptosis. Using high-content analysis, we examined the role of FKBPs in aggregation and apoptotic cell death. FK506, a specific inhibitor of this family of proteins, inhibited alpha-SYN aggregation and neuronal cell death in this synucleinopathy model dose dependently. Knockdown of FKBP12 or FKBP52 reduced the number of alpha-SYN aggregates and protected against cell death, whereas overexpression of FKBP12 or FKBP52 accelerated both aggregation of alpha-SYN and cell death. Thus, FK506 likely targets FKBP members in the cell culture model. Furthermore, oral administration of FK506 after viral vector-mediated overexpression of alpha-SYN in adult mouse brain significantly reduced alpha-SYN aggregate formation and neuronal cell death. Our data explain previously described neuroregenerative and neuroprotective effects of immunophilin ligands and validate FKBPs as a novel drug target for the causative treatment of PD.


Figures

Figure 1.
Figure 1.
Induction of α-SYN aggregation and apoptosis in SHSY5Y neuroblastoma cells by oxidative stress. A, B, ThioS staining (A) and immunocytochemical staining (B) of intracytoplasmic α-SYN aggregates in SHSY5Y cells after induction of oxidative stress. Scale bars, 10 μm. These images are used for manual quantification of aggregation. C, D, Pictures taken with the IN cell analyzer for high-content analysis. C, Example of nucleus detection via DAPI staining (left) and α-SYN detection via immunocytochemical staining (middle). D, Example of nucleus detection via DAPI staining (left) and α-SYN fibril detection via ThioS staining (middle). The cell nucleus is identified based on the DAPI fluorescence (blue) and the cytoplasm via the ThioS background fluorescence (green). Intracytoplasmic α-SYN inclusions (yellow) and nuclear apoptotic fragments (pink) are detected based on a high-intensity compared with the background staining in the cytoplasm and the nucleus, respectively. E, Percentage of cells containing α-SYN aggregates determined manually after induction of oxidative stress. Both wild-type SHSY5Y cells and α-SYN-overexpressing cells were analyzed. A luciferase-overexpressing cell line was used as a negative control. SEM is shown for each condition. F, High-content analysis determining percentage of cells with (1) α-SYN aggregates and (2) nuclear condensation in wild-type SHSY5Y cells with and without stress and in α-SYN-overexpressing SHSY5Y cells with stress. SEM is shown for each condition. G, Histogram of the area distribution of α-SYN aggregates per cell in the cells containing aggregates (high-content analysis). The percentage of cells with α-SYN aggregates for these cell lines is shown in F.
Figure 2.
Figure 2.
FK506 inhibits α-SYN aggregation and apoptosis in SHSY5Y cells. A, Effect of FK506 on α-SYN aggregation in α-SYN-overexpressing SHSY5Y cells. Cells were stained with ThioS after oxidative stress induction and counted for ThioS-positive inclusions. B, Dose-dependent inhibition of α-SYN aggregation and apoptosis by FK506 determined by high-content analysis. Cells were stained with DAPI and ThioS after induction of oxidative stress. SEM is shown for each condition. p values are indicated compared with control condition (DMSO vehicle without FK506).
Figure 3.
Figure 3.
Transient FKBP knockdown inhibits α-SYN aggregation and apoptosis in SHSY5Y cells. A, Western blot showing knockdown of FKBP12 in SHSY5Y cells. In each lane, 10 μg of total protein was loaded, and FKBP12 expression was visualized by immunoblot. Lane 1, Extract of untreated SHSY5Y cells. Lanes 2–6, Cell extracts made 1, 2, 3, 5, and 7 d after transfection with siFKBP12_86. Lane 7, Extract of untreated SHSY5Y cells. Lanes 8–12, Cell extracts made 1, 2, 3, 5, and 7 d after transfection with siFKBP12_121. B, Western blot of FKBP52 in the same cell extracts (3 d after transfection) with unaltered levels of FKBP52 after knockdown of FKBP12. GAPDH blotting controls for equal loading. C, Western blot showing FKBP52 knockdown in SHSY5Y cells. In each lane, cell extract containing 10 μg of total protein was loaded and FKBP52 expression was visualized. Lane 1, Extract of untreated SHSY5Y cells. Lanes 2–6, Cell extracts made 1, 2, 3, 5, and 7 d after transfection with siFKBP52_446. Lane 7, Extract of untreated SHSY5Y cells. Lanes 8–12, Cell extracts made 1, 2, 3, 5, and 7 d after transfection with siFKBP52_1023. D, Western blot of FKBP12 in the same cell extracts (3 d after transfection) with unaltered levels of FKBP12 after knockdown of FKBP52. α-Tubulin or GAPDH blotting confirm equal loading. E, After 6 h of incubation with respective siRNA molecules, oxidative stress was induced for 72 h. SHSY5Y cells without siRNA treatment were used as a control. The percentage of ThioS-positive α-SYN aggregates was determined. SEM is shown for each condition. p values are indicated compared with control condition (mock transfection).
Figure 4.
Figure 4.
Stable FKBP12 knockdown inhibits α-SYN aggregation and apoptosis in SHSY5Y cells. A, Left, Western blot showing stable FKBP12 knockdown in wild-type SHSY5Y cells after transduction with LV encoding shFKBP12 or shFKBP12_MM, followed by selection with hygromycin. In each lane, cell extract containing 10 μg of total protein was loaded and FKBP12 expression was visualized. Lane 1, Untreated SHSY5Y cells. Lane 2, FKBP12-overexpressing SHSY5Y. Lane 3, Knockdown of endogenous FKBP12 by shFKBP12. Lane 4, SHSY5Y expressing shFKBP12_MM. GAPDH expression is shown as loading control. FKBP52 expression is unaffected by FKBP12 overexpression or knockdown. Right, Stable FKBP12 knockdown in SHSY5Y cells overexpressing α-SYN. Lane 1, FKBP12-overexpressing α-SYN–SHSY5Y. Lane 2, Knockdown of endogenous FKBP12. Lane 3, α-SYN–SHSY5Y expressing shFKBP12_MM. Lane 4, α-SYN–SHSY5Y. B, High-content analysis of α-SYN aggregation and apoptosis in SHSY5Y cells and α-SYN–SHSY5Y cells after knockdown of FKBP12. Error bars indicate the SEM. p values are indicated compared with control condition (cell lines expressing shFKBP12_MM).
Figure 5.
Figure 5.
FKBP overexpression enhances α-SYN aggregation and apoptosis in SHSY5Y cells. A, Expression of α-SYN, FKBP12, FKBP52, and luciferase in stable cell lines. Western blot of cell extracts of the different stable cell lines generated. Lanes 1, 3, 5, 7, Untransduced SHSY5Y cells. Lane 2, SHSY5Y cells overexpressing α-SYN (14.4 kDa). Lane 4, SHSY5Y cells overexpressing FKBP12 (12 kDa). Lane 6, SHSY5Y cells overexpressing FKBP52 (52 kDa). Lane 8, SHSY5Y cells overexpressing luciferase (61 kDa). α-Tubulin expression is shown below to confirm equal loading. B, Subcellular localization of FKBP12 and α-SYN aggregates in overexpression cell lines. Fixed and stained SHSY5Y cells overexpressing FKBP12 exposed to oxidative stress for 48 h. Left, ThioS (green) stains α-SYN fibrils (arrows). Middle, Immunocytochemical FKBP12 staining is shown in red. Right, Overlay image. C, Subcellular localization of FKBP52 and α-SYN aggregates in overexpression cell lines. Fixed and stained SHSY5Y cells overexpressing FKBP52 exposed to oxidative stress for 48 h. Left, ThioS (green) stains α-SYN fibrils (arrows). Middle, Immunocytochemical FKBP52 staining is shown in red. Right, Overlap image. D, Analysis of the effect of FKBP12 and FKBP52 overexpression on the aggregation of α-synuclein. Cells were subjected to oxidative stress for 48 h in the presence or absence of FK506 before ThioS staining. WT SHSY5Y cells and luciferase-overexpressing cells are shown as negative controls. The percentage of ThioS-positive cells was determined in the different conditions. p values are indicated compared with control condition (cell lines without FK506 treatment) or as indicated in the graph. E, High-content analysis of the effect of FKBP12 overexpression on the aggregation of α-SYN in both WT SHSY5Y and α-SYN–SHSY5Y. The error bars show the SEM for each condition. p values are indicated compared with control condition (cell lines with endogenous FKBP12 expression).
Figure 6.
Figure 6.
FK506 treatment reduces α-SYN aggregation and neurodegeneration in mouse brain. A, Colocalization of FKBP12 (red) and α-SYN-positive LB-like inclusions (green) in the deep mesencephalic nuclei of 19-month-old Thy1–A30P–α-SYN transgenic mice (Freichel et al., 2007). Cytoplasmic α-SYN inclusions are indicated with arrows. B, Immunohistochemical staining of α-SYN in the striatum of mice injected with α-SYN encoding LV. Inlay images show high-magnification views of two α-SYN-positive neurons without (left) or with (right) α-SYN inclusions. C, Immunofluorescent staining for α-SYN and ubiquitin in the striatum 5 months after injection with α-SYN LV. Detailed pictures on the right show colocalization of α-SYN (green) and ubiquitin (red) in the inclusions. D, Number of α-SYN aggregates in α-SYN-overexpressing neurons in the striatum. The fraction of α-SYN-positive neurons that contain inclusions was determined. FK506 treatment decreases the number of α-SYN-positive neurons. Error bars show SEM (n = 6–7). E, Survival of α-SYN-overexpressing cells in the striatum after FK506 treatment. The α-SYN-positive area was quantified using the Cavalieri method as a measure for the number of α-SYN-overexpressing cells. In the groups treated with FK506, more α-SYN-overexpressing cells survive. Error bars show the SEM (n = 6–7).

Similar articles

Cited by

References

    1. Avramut M, Achim CL. Immunophilins and their ligands: insights into survival and growth of human neurons. Physiol Behav. 2002;77:463–468. - PubMed
    1. Avramut M, Zeevi A, Achim CL. The immunosuppressant drug FK506 is a potent trophic agent for human fetal neurons. Brain Res Dev Brain Res. 2001;132:151–157. - PubMed
    1. Bertoncini CW, Jung YS, Fernandez CO, Hoyer W, Griesinger C, Jovin TM, Zweckstetter M. Release of long-range tertiary interactions potentiates aggregation of natively unstructured alpha-synuclein. Proc Natl Acad Sci U S A. 2005;102:1430–1435. - PMC - PubMed
    1. Brecht S, Schwarze K, Waetzig V, Christner C, Heiland S, Fischer G, Sartor K, Herdegen T. Changes in peptidyl-prolyl cis/trans isomerase activity and FK506 binding protein expression following neuroprotection by FK506 in the ischemic rat brain. Neuroscience. 2003;120:1037–1048. - PubMed
    1. Charters AR, Kobayashi M, Butcher SP. Immunochemical analysis of FK506 binding proteins in neuronal cell lines and rat brain. Biochem Soc Trans. 1994a;22:411S. - PubMed

Publication types

MeSH terms