. 2010 Feb 17;30(7):2521-32.
doi: 10.1523/JNEUROSCI.5500-09.2010.

Alternative splicing of the histone demethylase LSD1/KDM1 contributes to the modulation of neurite morphogenesis in the mammalian nervous system

Affiliations

Alternative splicing of the histone demethylase LSD1/KDM1 contributes to the modulation of neurite morphogenesis in the mammalian nervous system

Cristina Zibetti et al. J Neurosci. .

Abstract

A variety of chromatin remodeling complexes are thought to orchestrate transcriptional programs that lead neuronal precursors from earliest commitment to terminal differentiation. Here we show that mammalian neurons have a specialized chromatin remodeling enzyme arising from a neurospecific splice variant of LSD1/KDM1, histone lysine specific demethylase 1, whose demethylase activity on Lys4 of histone H3 has been related to gene repression. We found that alternative splicing of LSD1 transcript generates four full-length isoforms from combinatorial retention of two identified exons: the 4 aa exon E8a is internal to the amine oxidase domain, and its inclusion is restricted to the nervous system. Remarkably, the expression of LSD1 splice variants is dynamically regulated throughout cortical development, particularly during perinatal stages, with a progressive increase of LSD1 neurospecific isoforms over the ubiquitous ones. Notably, the same LSD1 splice dynamics can be fairly recapitulated in cultured cortical neurons. Functionally, LSD1 isoforms display in vitro a comparable demethylase activity, yet the inclusion of the sole exon E8a reduces LSD1 repressor activity on a reporter gene. Additional distinction among isoforms is supported by the knockdown of neurospecific variants in cortical neurons resulting in the inhibition of neurite maturation, whereas overexpression of the same variants enhances it. Instead, perturbation of LSD1 isoforms that are devoid of the neurospecific exon elicits no morphogenic effect. Collectively, results demonstrate that the arousal of neuronal LSD1 isoforms pacemakes early neurite morphogenesis, conferring a neurospecific function to LSD1 epigenetic activity.


Figures

Figure 1.
Figure 1.
Genomic organization of human LSD1 gene. A, Schematic representation of the human LSD1 protein domains together with its exons ranging from 1 to 19; asterisks indicate the location of annotated alternative exons (E2a and E8a). Different colors in grayscale indicate functional domains. N-terminal unstructured region (white) coded by exons 1–2, SWIRM domain (black) coded by exons 2–4, the SWIRM-oxidase connector (black striped) coded by exon 5, the amine oxidase domain (gray), coded by exons 6–9 and exons 13–19, and the tower domain (gray striped) coded by exons 10–12. Residue Met1 of this sequence corresponds to the first amino acid of the protein characterized (Shi et al., 2004). B, Human AOF2 alignment across vertebrates by GenomeVista browser (http://pipeline.lbl.gov/cgi-bin/GenomeVista). The “peaks and valleys” graphs represent percentage conservation at a given genomic coordinate between aligned sequences and the human sequence. Human exons are numbered. The top and bottom percentage bounds are shown to the right of every row. Regions of high conservation are colored as exons (dark gray) or noncoding (light gray). Conserved regions are defined as regions with identity of 70% or higher that are wider than or equal to “minimal conservation width” (100 bp). C, Enlarged view of 650 bp of the alignment between human and mouse intronic regions containing the two alternatively spliced exons (E2a and E8a) and one constitutively included exon (E13). Highlighted bars above the conservation area correspond to annotated E2a, E8a, and E13 of human AOF2. Dark gray areas within the conservation graph mark exons; light gray areas mark conserved (above 70%) nonexonic sequences.
Figure 2.
Figure 2.
Mammalian LSD1 transcript undergoes alternative splicing and produces four isoforms with different tissue distribution. A, Exon structure of the mammalian LSD1 gene and position of the primers used to identify full-length, polyadenylated transcripts characterized by the presence or absence of E2a and E8a. Primers are indicated as F for forward or R for reverse, and the numbers indicate the exons where each primer anneals. Total RNA from human adult tissues (B) and total RNA from mouse adult brain tissues (D) were tested for LSD1 splicing variant expression by RT-PCR. The cDNA were amplified with primers covering the entire coding sequence (primers 1F and 19R) and reamplified with two different nested PCR, one including E8a (PCR1) and one excluding E8a (PCR2). β-Actin was used as control. C, Structure of the four LSD1 variants. E, F, Isoform-relative quantification of LSD1 splicing variants in mouse brain areas, primary neuronal cultures, and astroglia. rqf-PCR on cDNA obtained from total RNA of the indicated samples. Amplicons were quantified by related fluorescence units (RFU) by GeneMapper software and graphed as percentage relative to the sum of all the isoforms. Neurospecific LSD1 isoforms are shown in black and dark gray, whereas ubiquitous ones are shown in light gray and white. G, Splicing generates four different LSD1 proteins. Western blots of total protein extracts from mouse brain and heart probed with a panLSD1 antibody and migration of recombinant LSD1 isoforms transfected in HeLa cells probed with anti-HA antibody. All the indicated samples were run on the same polyacrylamide gel. H, Anti-LSD1-8a antibody specificity was assessed by Western blot on total protein extracts from heart and brain rat tissues and HeLa cells transfected with pCGN vector (mock), HA-tagged LSD1, or HA-tagged LSD1-8a cDNAs.
Figure 3.
Figure 3.
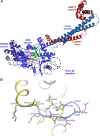
Comparative structural analysis of LSD1 and the LSD1-8a splice variant. A, Overall crystal structure of LSD1-8a–CoREST in complex with a histone peptide. LSD1-8a (residues 171-840) is in light blue, CoREST (residues 308-440) in red, and the histone H3 peptide (residues 1-16) in green. The FAD cofactor is in the orange ball-and-stick representation. The insertion site of E8a (residues Asp369A-Thr369B-Val369C-Lys369D) is highlighted. B, Close-up view of LSD1-8a structure at the site of exon E8a insertion. LSD1-8a structure is in blue, and it is superimposed onto native LSD1 (yellow; Protein Data Bank entry 2v1d) (Forneris et al., 2007). The orientation of the proteins is the same as in Figure 3A. The side chains of exon E8a residues are labeled in bold. Exon E8a insertion protrudes from the main body of the protein.
Figure 4.
Figure 4.
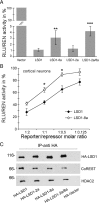
Effect of the included exon E2a and/or E8a on LSD1 repressor activity and affinity for corepressor partners. A, The four indicated LSD1 splice variants fused to Gal4–DBD were assayed for their ability to repress a reporter gene on HeLa cells at a constant reporter/repressor molar ratio. B, In rat cortical neurons, LSD1 and LSD1-8a were compared at different reporter/repressor molar ratios. The luciferase activity normalized over the activity of a cotransfected renilla reporter is expressed as percentage of the activity of the Gal4–DBD vector at each molar ratio. Values are derived from at least three independent experiments. In A and B, a Student's t test (l Stat t IT α/2) was applied to percentage values by comparing splicing isoforms with LSD1. *p < 0.05; **p < 0.01; ***p < 0.001. C, Whole-cell immunocomplexes from HeLa cells overexpressing the indicated HA–LSD1 isoforms were obtained by HA antibodies and separated by SDS-PAGE. The Western blots were probed with antibodies to HA, CoREST, and HDAC2.
Figure 5.
Figure 5.
Inclusion of neurospecific E8a in LSD1 transcripts is dynamically modulated during neuronal development, whereas inclusion of E2a is a steady event. The relative amount of each LSD1 isoform was measured by rqf-PCR; cDNA were obtained from total RNA from rat embryonic cortex (E18.5), postnatal rat cortex (PN), and adult rat cortex. Graphs represent the relative percentage of each isoform with respect to the sum of the four. Only two isoforms are shown per graph; A compares LSD1 isoform with LSD1-8a, whereas B compares LSD1-2a isoform with LSD1-2a/8a. Values shown are mean ± SD. C, Exon inclusion frequency of exons E2a and E8a. Each represented series relates to the overall inclusion of either E8a (black squares) calculated as the sum of LSD1-2a/8a and LSD1-8a relative percentage and E2a (white squares), calculated as sum of LSD1-2a and LSD1-2a/8a relative percentage, at each indicated developmental stage. D, Total LSD1 transcript quantification by qRT-PCR on total RNA extract from the indicated rat cortex samples normalized on β-actin. Samples are expressed as fold increase relative to the LSD1 value at E18.5. Western blot on total protein samples from the indicated development cortical stages with a panLSD1 antibody or neurospecific LSD1 antibody (E) and with the indicated synaptic markers (F).
Figure 6.
Figure 6.
LSD1 splicing analysis in a rat cortical neuron maturation system. A, In vitro maturation of cortical neurons prepared from E18.5 embryos (DIV0) was assessed by Western blot analysis of the indicated synaptic markers on total protein samples from the indicated DIV. Graphs represent the relative percentage of each isoform with respect to the sum of the four. Only two isoforms are shown per graph; B compares LSD1 isoform with LSD1-8a, whereas C compares LSD1-2a isoform with LSD1-2a/8a. Values shown are mean ± SD. D, Exon inclusion frequency of exons E2a and E8a. Each represented series relates to the overall inclusion of either E8a (black squares), calculated as the sum of LSD1-2a/8a and LSD1-8a relative percentage, and E2a (white squares), calculated as the sum of LSD1-2a and LSD1-2a/8a relative percentage, at each indicated developmental stage. E, Western blot on total protein samples from the indicated DIV with a panLSD1 antibody.
Figure 7.
Figure 7.
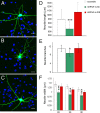
Effect of neurospecific or ubiquitous LSD1 knockdown by shRNAs on neurite morphology in rat cortical neurons. Cultured cortical neurons were transiently transfected with pSuper GFP Neo control (scramble) (A), pSuper engineered with shRNA against exon E8a (shRNA vs 8a) (B), and pSuper engineered with shRNA against the splice junction between exons E8 and E9 (shRNA vs 8/9) (C). Morphology was analyzed for EGFP-positive neurons with DAPI (4′,6′-diamidino-2-phenylindole) counterstain. D, Cumulative neurite length in differentially LSD1 knocked down neurons is indicated as average ± SEM in micrometers. E, Secondary branches count is indicated ± SEM. F, Average neurite width by Sholl analysis calculated on inner, intermediate, and outer Sholl's circles corresponding to 20, 25, and 30 μm radii, respectively. Values shown are mean ± SEM width in micrometers. Student's t test (l Stat t IT α/2) was applied to values by comparing each condition with control scramble. *p < 0.05; **p < 0.01; ***p < 0.001. Scale bars, 20 μm.
Figure 8.
Figure 8.
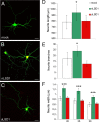
Effect of overexpression of neurospecific or ubiquitous LSD1 isoforms on neurite morphology in rat cortical neurons. Primary rat cortical neurons were transiently cotransfected with pCGN vector (mock) (A), EGFP together with HA–LSD1-8a plus LSD1-2a/8a (nLSD1) (B), HA–LSD1 plus LSD1-2a (uLSD1) (C). Morphology was analyzed in EGFP-positive neurons (mock) or double-labeled EGFP- and HA-positive neurons. D, Cumulative neurite length in differentially LSD1 transfected neurons is indicated as average ± SEM in micrometers. E, Secondary branches count is indicated ± SEM. F, Average neurite width by Sholl analysis calculated on inner, intermediate, and outer Sholl's circles corresponding to 20, 25, and 30 μm radii, respectively. Values shown are mean ± SEM width in micrometers. Student's t test (l Stat t IT α) was applied to values by comparing each condition with mock. *p < 0.05; **p < 0.01; ***p < 0.001. Scale bars, 20 μm.

Similar articles

Cited by

References

    1. Allis CD, Berger SL, Cote J, Dent S, Jenuwien T, Kouzarides T, Pillus L, Reinberg D, Shi Y, Shiekhattar R, Shilatifard A, Workman J, Zhang Y. New nomenclature for chromatin-modifying enzymes. Cell. 2007;131:633–636. - PubMed
    1. Andrés ME, Burger C, Peral-Rubio MJ, Battaglioli E, Anderson ME, Grimes J, Dallman J, Ballas N, Mandel G. CoREST: a functional corepressor required for regulation of neural-specific gene expression. Proc Natl Acad Sci U S A. 1999;96:9873–9878. - PMC - PubMed
    1. Ballas N, Battaglioli E, Atouf F, Andres ME, Chenoweth J, Anderson ME, Burger C, Moniwa M, Davie JR, Bowers WJ, Federoff HJ, Rose DW, Rosenfeld MG, Brehm P, Mandel G. Regulation of neuronal traits by a novel transcriptional complex. Neuron. 2001;31:353–365. - PubMed
    1. Ballas N, Grunseich C, Lu DD, Speh JC, Mandel G. REST and its corepressors mediate plasticity of neuronal gene chromatin throughout neurogenesis. Cell. 2005;121:645–657. - PubMed
    1. Barak O, Lazzaro MA, Cooch NS, Picketts DJ, Shiekhattar R. A tissue-specific, naturally occurring human SNF2L variant inactivates chromatin remodeling. J Biol Chem. 2004;279:45130–45138. - PubMed

Publication types

MeSH terms