. 2010 Feb 17;30(7):2650-61.
doi: 10.1523/JNEUROSCI.1617-09.2010.

Stored-trace reactivation in rat prefrontal cortex is correlated with down-to-up state fluctuation density

Affiliations

Stored-trace reactivation in rat prefrontal cortex is correlated with down-to-up state fluctuation density

Lise A Johnson et al. J Neurosci. .

Abstract

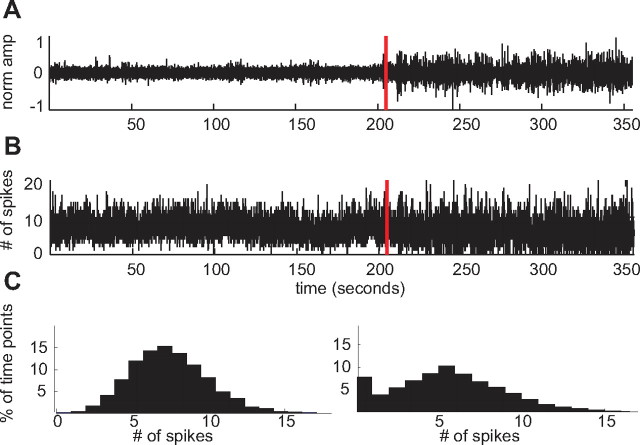
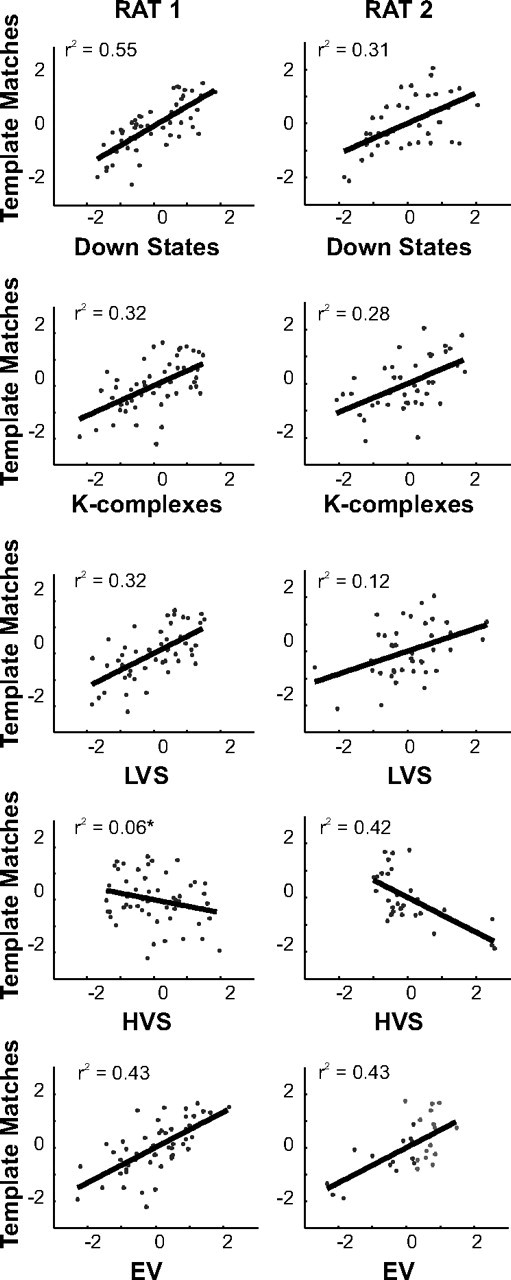
Spontaneous reactivation of previously stored patterns of neural activity occurs in hippocampus and neocortex during non-rapid eye movement (NREM) sleep. Notable features of the neocortical local field potential during NREM sleep are high-amplitude, low-frequency thalamocortical oscillations including K-complexes, low-voltage spindles, and high-voltage spindles. Using combined neuronal ensemble and local field potential recordings, we show that prefrontal stored-trace reactivation is correlated with the density of down-to-up state transitions of the population of simultaneously recorded cells, as well as K-complexes and low-voltage spindles in the local field potential. This result strengthens the connection between reactivation and learning, as these same NREM sleep features have been correlated with memory. Although memory trace reactivation is correlated with low-voltage spindles, it is not correlated with high-voltage spindles, indicating that despite their similar frequency characteristics, these two oscillations serve different functions.


Figures

Figure 1.
Figure 1.
K-complexes and down states. A, B, The LFP (A) and the sum spikes from 135 single neurons (B) from a single experimental session are averaged on the down state to up state transitions. Before averaging, the LFP is normalized to the maximum value recorded on that electrode during that recording session. The red dot marks the transition point. Standard deviations are in green. In A, one-hundred fifty-five 2 s sections of one normalized LFP trace are centered on the down–up transitions identified in the sum of spikes. The characteristic shape of the K-complex is clearly revealed in the mean activity. The mean of the total activity (50 ms bins) in B is from the same 135 cells from which the down states were identified. C, D, During an epoch marked by up-and-down states (taken from a single session), the down states tend to recur at ∼1 Hz, as is indicated by the distribution of intervals (C), which peaks at ∼1 s; however, the distribution of intervals between down states is approximately exponential as shown on a logarithmic scale (D), indicating that down state occurrence is not a true oscillation, but essentially a random process.
Figure 2.
Figure 2.
Examples of LFP and the sum of single-cell activity during periods of motion and motionlessness. A, During the full sleep epoch, the animal alternated between times of waking motion and quiet motionlessness. Motionless periods are indicated by a gray background. In the top panel is one LFP trace, in the middle panel is the absolute value of the total velocity, and the bottom panel is the sum of single-cell activity (124 cells, 30 ms bins). Wakefulness is marked by high-frequency, low-amplitude oscillations in the LFP and consistent spiking in the single units (no bins contain 0 spikes). Motionlessness, on the other hand, is marked by periods of high-amplitude, low-frequency oscillations in the LFP and multiple down states (number of spikes goes to 0 in several bins) in the single-unit activity. B, When a motionless period is examined on a finer timescale, it is clear that the system is sometimes in a state similar to that seen during motion. However, that state is punctuated by two additional low-frequency, high-amplitude “states.” These are HVSs (left arrow) and K-complexes/LVSs (right arrow). Arrows mark the approximate middle of these events. Bouts of HVSs and K-complexes/LVSs are visible not only in the LFP (top), but also in the sum of single-cell activity (bottom).
Figure 3.
Figure 3.
Example of HVS epoch and down state/K-complex/LVS epoch. A, HVS epochs occur during periods of low-frequency, high-amplitude activity in the LFP (top). These oscillations are also identifiable in the total spike activity, which oscillates at the same frequency as the LFP during HVSs (124 cells, 30 ms bins, middle). The red bars indicate the onset of the HVS epoch. In the spectrogram of the LFP (bottom, hot colors = high power), HVSs are marked by a strong peak at 7–8 Hz and smaller peaks at several harmonics. B, K-complex/LVS epochs also occur during periods of low-frequency, high-amplitude activity in the LFP (top). These periods correspond to periods of up state/down state fluctuations in the total spike activity (124 cells, 30 ms bins, middle). A clear example LVS preceded by a K-complex is marked by the arrow in the top panel. Each K-complex in the LFP is matched by a network down state in the total spike activity (red bars). In the spectrogram of the LFP (bottom), the K-complexes correspond to high power in the 2–6 Hz range, while LVSs correspond to a peak in the 10–20 Hz range. Although the LVS example shown here shows power in a frequency range distinct from HVSs, in fact many LVS episodes show power in frequencies ranging from 6 to 20 Hz, thus largely overlapping with HVSs. Spectrograms were computed over 1 s Hamming windows with 95% overlap between the windows and evaluated at 210 frequency points. Shown here are normalized versions; hot colors = high power.
Figure 4.
Figure 4.
Spindle distributions. For one session from each rat (rows), the LFP trace was binned (250 ms) and the power and variance of each bin were calculated. Bins where the power exceeded two times the standard deviation of the power in the 6–20 Hz band were selected and further analyzed. In the first column, the 10–20 Hz power of the selected bins is plotted against the 7–8 Hz power of the same bins. The two clusters correspond to HVSs (green) and LVSs (red). In the second column, the depth of modulation (variance) in the LFP for the same bins is plotted against the depth of modulation in the sum of individual spikes over the same time period. Clusters form in both frequency and in depth of modulation, indicating that the two different types of spindles are drawn from different populations. These results are typical for sleep sessions with both HVSs and LVSs.
Figure 5.
Figure 5.
Distribution of population activity states during waking and motionlessness. A, B, Dividing the LFP (A) into periods without K-complexes (left of the red bar) and periods with K-complexes (right of the red bar) is equivalent to dividing the total spike activity (135 cells, 30 ms bins, B) into periods without down states (left of the red bar) and periods of fluctuation between down states and up states (right of the red bar). C, This difference is reflected in the distribution of the total spike activity; the distribution (taken from the data shown in B) is unimodal when there are no down states (left) and bimodal during periods of down state/up state fluctuations (right).
Figure 6.
Figure 6.
Linear regression plots for EV. In each plot, the data points for all sleep epochs and all recording sessions are compiled. The z-scores of the explained variance, EV, are on the y-axis; the z-score of the number of down states, the number of K-complex events, the number of LVS events, and the number of HVS events are on the x-axis. All correlations are significant (p < 0.05). The results for rat 1 include data from 33 d and a total of 359 data points. The EV ranged between 0.0 and 0.27. The results for rat 2 include data from 3 d and total of 72 data points. The EV value ranged between 0.0 and 0.19. The results for rat 3 include data from 12 d and 583 data points. The EV value ranged between 0.0 and 0.35. For all three rats, the EV was significantly positively correlated with the down states, K-complexes, and LVSs. HVSs are anticorrelated with EV, signifying that the two different kinds of spindles have different functional implications.
Figure 7.
Figure 7.
Linear regression plots for template matching. Data for rat 1 are shown in column 1. In each plot, all data points from the third sleep epoch of seven recording sessions (52 data points) are compiled. The z-scores of the template matches are plotted on the y-axis; the z-scores of the down states, K-complexes, LVSs, HVSs, and EV are on the x-axis. The number of template matches ranged from 8 to 1325. A similar set of plots for rat 2 are shown in column 2. In each plot, all data points from the third sleep epoch of three recording sessions (41 data points) are compiled. The number of template matches ranged from 41 to 399. With the exception of the template match/HVS relationship for the first rat (marked with an asterisk), all correlations were significant (p < 0.05). The relationships between the template matching and the various events are similar to the relationships between the EV and those events, and the EV and template-matching measures are also highly correlated. This allows for a consistent interpretation of the correlations (or lack thereof) between the sleep events and memory replay.

Similar articles

Cited by

References

    1. Aldinio C, Aporti F, Calderini G, Mazzari S, Zanotti A, Toffano G. Experimental models of aging and quinolinic acid. Methods Find Exp Clin Pharmacol. 1985;7:563–568. - PubMed
    1. Amzica F, Steriade M. The K-complex: its slow (<1-Hz) rhythmicity and relation to delta waves. Neurology. 1997;49:952–959. - PubMed
    1. Amzica F, Steriade M. Cellular substrates and laminar profile of sleep K-complex. Neuroscience. 1998;82:671–686. - PubMed
    1. Amzica F, Steriade M. The functional significance of K-complexes. Sleep Med Rev. 2002;6:139–149. - PubMed
    1. Battaglia FP, Sutherland GR, McNaughton BL. Hippocampal sharp wave bursts coincide with neocortical “up-state” transitions. Learn Mem. 2004;11:697–704. - PMC - PubMed

Publication types