

EEG measures index neural and cognitive recovery from sleep deprivation
- PMID: 20164352
- PMCID: PMC2835412
- DOI: 10.1523/JNEUROSCI.4010-09.2010
EEG measures index neural and cognitive recovery from sleep deprivation
Abstract
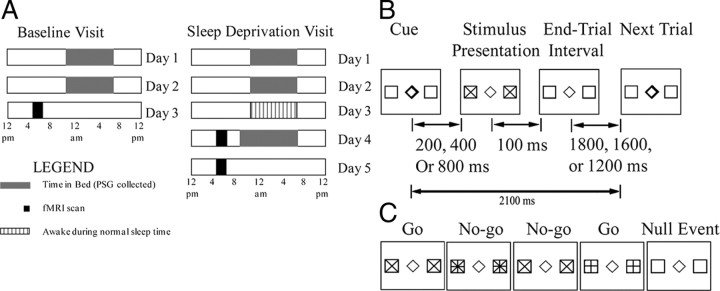
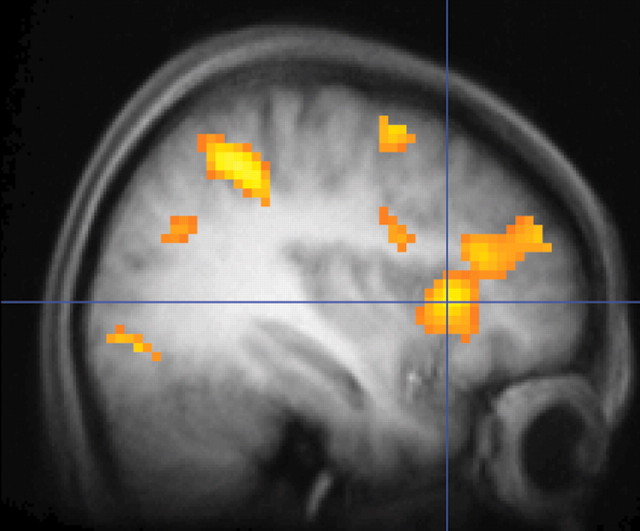
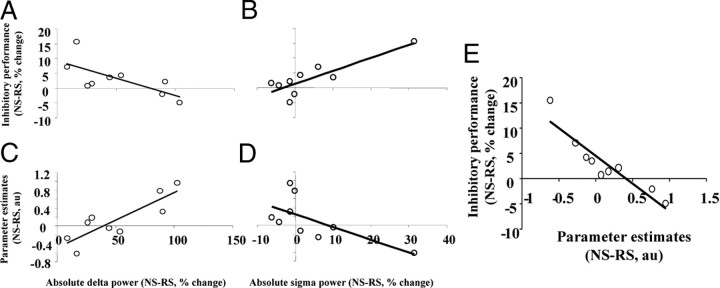
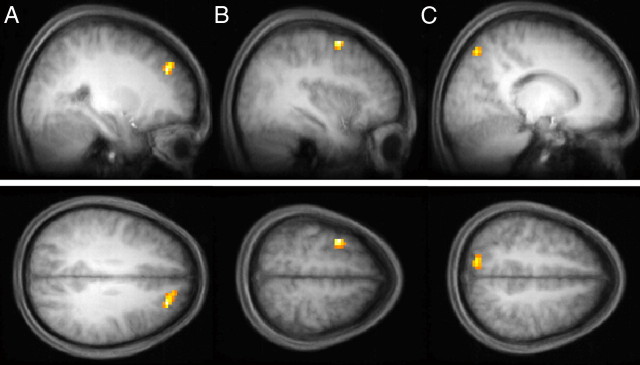
Sleep deprivation impairs many cognitive abilities, but these impairments can be reversed after a certain quantity and quality of sleep. The ability to inhibit responding is particularly susceptible to disruption after prolonged wakefulness. How recovery sleep (RS) alters brain activity, leading to improved performance on a variety of cognitive tasks, remains unclear. This issue was examined in the current study using spectral analysis of electroencephalogram (EEG) data during sleep. These measures of sleep physiology were acquired after both normal sleep (NS) and RS, and were related to measures of inhibitory control and concurrent brain activity. Subjects were nine young adults who underwent functional magnetic resonance imaging twice, after 9 h of NS and after 10 h of RS that followed 38 h of being awake. A multiple regression model was used to examine differences between conditions in (1) EEG spectral power during sleep, (2) probability of successful inhibition in a go/no-go task, and (3) activation within a region of right prefrontal cortex during the task. Performance recovery, as indexed by reduced performance differences between conditions, was predicted by increased delta power and decreased sigma power in RS compared with NS. These EEG variables predicted most of the variance in inhibitory performance difference between conditions. Regressions also suggested that RS improved performance because of changes in brain function including prefrontal regions that resulted from delta rebound. We thus propose that slow waves, reflected in delta power during RS, act to restore brain function, thereby improving cognitive performance that entails response inhibition.
Conflict of interest statement
All of the authors have indicated no financial conflicts of interest.
Figures
References
-
- Aguirre GK, Zarahn E, D'Esposito M. The inferential impact of global signal covariates in functional neuroimaging analyses. Neuroimage. 1998;8:302–306. - PubMed
-
- Bellgrove MA, Hester R, Garavan H. The functional neuroanatomical correlates of response variability: evidence from a response inhibition task. Neuropsychologia. 2004;42:1910–1916. - PubMed
-
- Blake H, Gerard RW. Brain potentials during sleep. Am J Physiol. 1937;119:692–703.
-
- Bonnet MH. Recovery of performance during sleep following sleep deprivation in older normal and insomniac adult males. Percept Mot Skills. 1985;60:323–334. - PubMed
Publication types
MeSH terms
Substances
Grants and funding
LinkOut - more resources
Full Text Sources
Miscellaneous