. 2010 Feb 17;30(7):2741-54.
doi: 10.1523/JNEUROSCI.5390-09.2010.

Structural determinants of D-cycloserine efficacy at the NR1/NR2C NMDA receptors

Affiliations

Structural determinants of D-cycloserine efficacy at the NR1/NR2C NMDA receptors

Shashank M Dravid et al. J Neurosci. .

Abstract

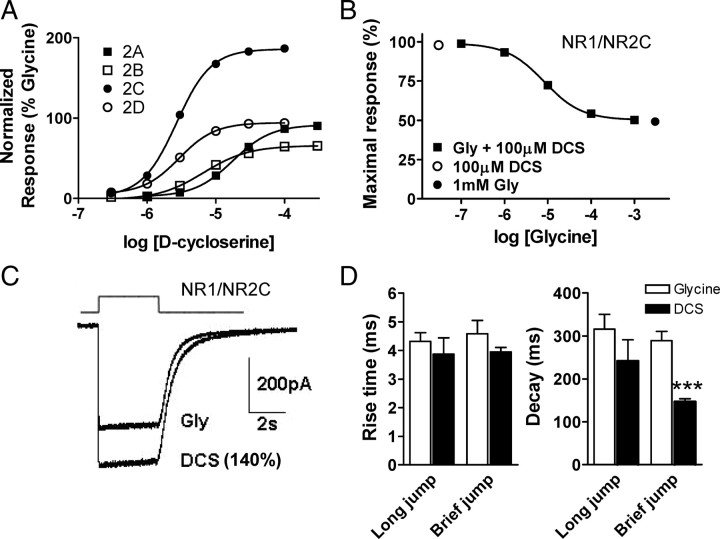
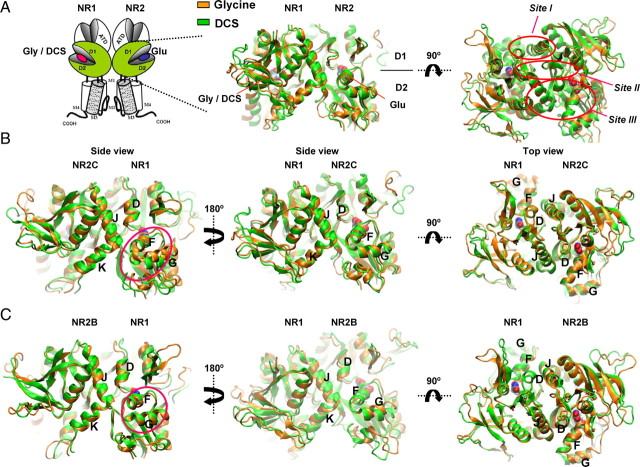
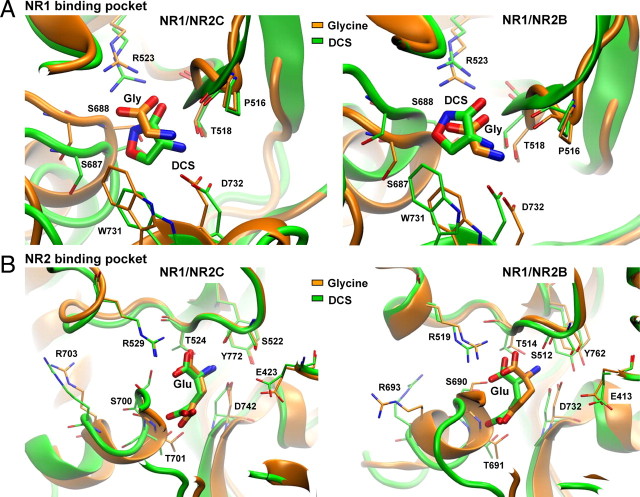
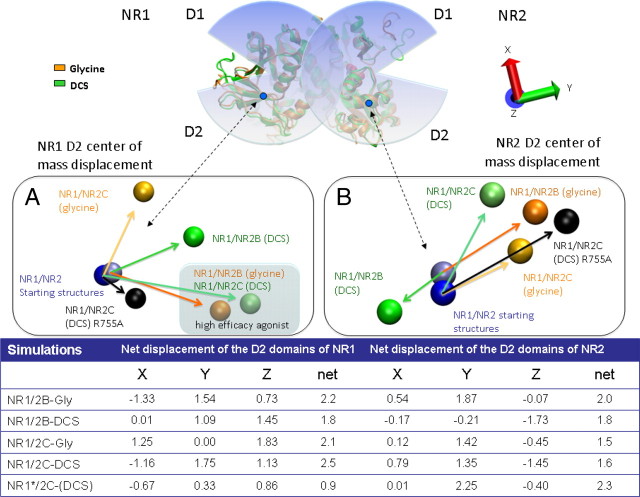
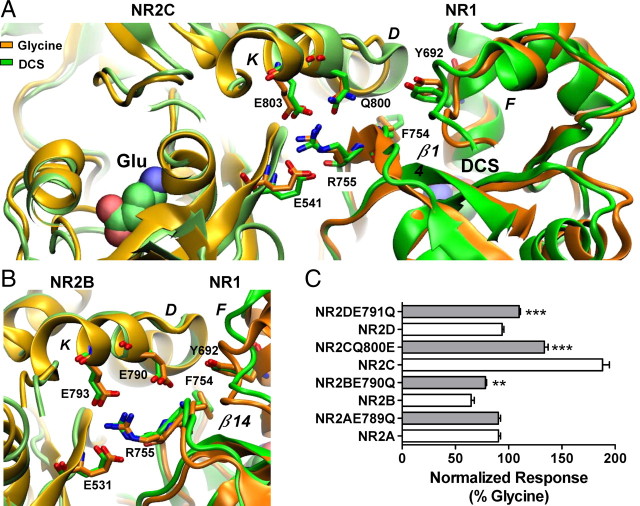
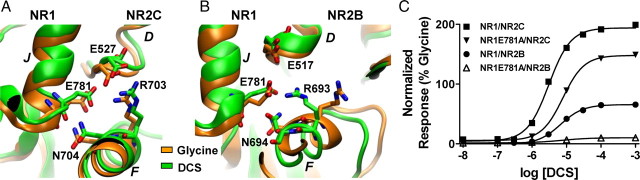
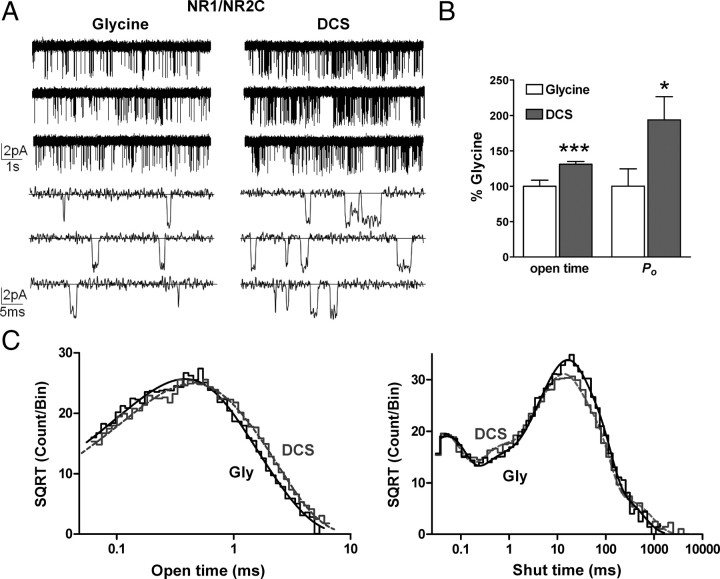
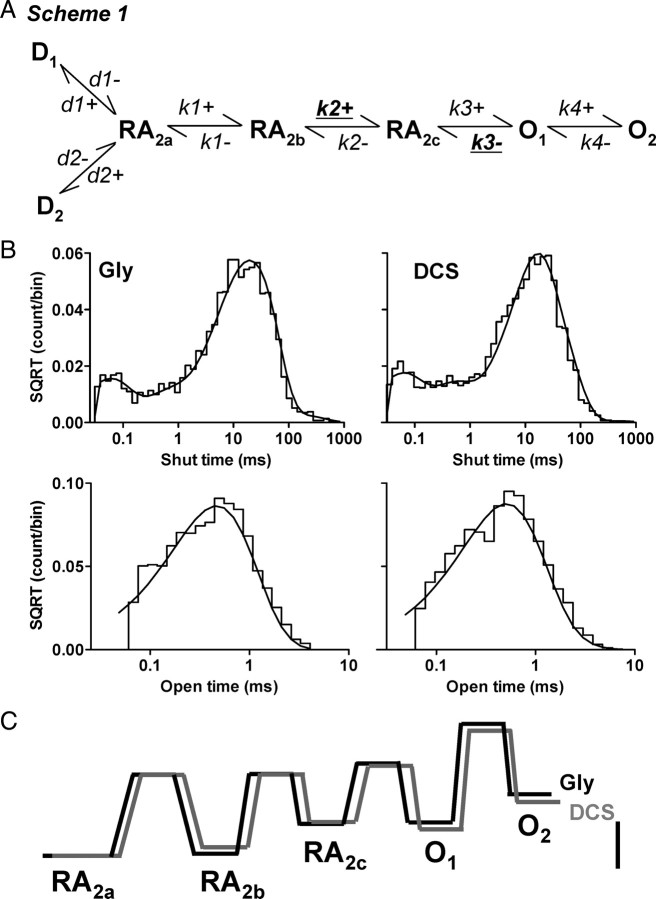
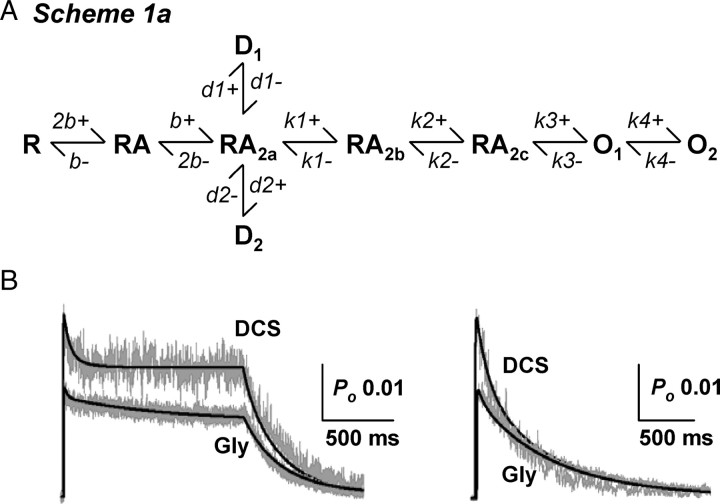
We have studied relative efficacies of NR1 agonists glycine and d-cycloserine (DCS), and found efficacy to be dependent on the NR2 subunit. DCS shows partial agonism at NR1/NR2B but has higher relative efficacy than glycine at NR1/NR2C receptor. Molecular dynamics (MD) simulations of the NR1/NR2B and NR1/NR2C agonist binding domain dimer suggest only subtle differences in the interactions of DCS with NR1 binding site residues relative to glycine. The most pronounced differences were observed in the NR1/NR2C simulation between the orientation of helices F and G of the NR1 subunit. Interestingly, Helix F was previously proposed to influence receptor gating and to adopt an orientation depending on agonist efficacy. MD simulations and site-directed mutagenesis further suggest a role for residues at the agonist binding domain dimer interface in regulating DCS efficacy. To relate the structural rearrangements to receptor gating, we recorded single-channel currents from outside-out patches containing a single active NR1/NR2C receptor. DCS increased the mean open time and open probability of NR1/NR2C receptors compared with glycine. Maximum likelihood fitting of a gating model for NR1/NR2C receptor activation to the single-channel data suggests that DCS specifically accelerates the rate constant governing a fast gating step and reduces the closing rate. These changes appear to reflect a decreased activation energy for a pregating step and increased stability of the open states. We suggest that the higher efficacy of DCS at NR1/NR2C receptors involves structural rearrangements at the dimer interface and an effect on NR1/NR2C receptor pregating conformational changes.


Figures

Figure 1.
Figure 1.
d-Cycloserine has higher relative efficacy than glycine at NR1/NR2C receptors. A, Concentration–response curves for DCS normalized to the response to a maximally effective concentration of glycine (100 μm glycine) at all NR1/NR2 subunit combinations determined by TEVC recordings from Xenopus oocytes (VHOLD, −40 mV). The relative efficacy and EC50 values are summarized in Table 1. All voltage-clamp recordings were performed with 100 μm glutamate as a coagonist. B, The higher relative efficacy of 100 μm DCS is reduced with increasing concentrations of glycine co-applied at the NR1/NR2C receptor. C, Whole-cell current responses to rapid agonist concentration jumps from HEK293 cells expressing NR1/NR2C receptors (VHOLD, −80 mV). Current responses were evoked by 1 mm glutamate and 1 mm glycine or 1 mm DCS. The relative amplitude of the peak response in the same cell for DCS relative to glycine is 140 ± 8% (n = 4). The top trace is open tip potential. D, Time course of macroscopic NR1/NR2C receptor current responses from outside-out patches. Agonist concentration jumps were performed from maximal concentration of glycine or DCS (0.5 mm) into 1 mm glutamate plus glycine or DCS. The long and brief jumps were for a duration of 2 s and 5–8 ms, respectively. Comparison was done using unpaired t test; ***p < 0.001.
Figure 2.
Figure 2.
Molecular dynamics simulations of the NR1/NR2B and NR1/NR2C ligand binding domain dimer. A, Schematic showing the NMDA receptor subunit arrangement with the ligand binding domains of NR1 and NR2 subunit shown in green. Homology models of NR1/NR2B and NR1/NR2C were based on the crystal structure of NR1/NR2A (Furukawa et al., 2005); molecular dynamics simulations were run on the hydrated protein with glycine (orange) or DCS (green) docked into the NR1 pocket and glutamate in the NR2 pocket. Dimer interaction sites Site I-III are indicated by red circles. B, Molecular dynamics simulations of NR1/NR2C ligand binding domain dimer. The difference in orientation of helix F and G of NR1 is evident (circled in side view). In addition, differences in arrangement of helices F and K of NR2C can be seen. C, Molecular dynamics simulations of NR1/NR2B ligand binding domain dimer. The difference in orientation of helices F and G of NR1 is evident (circled in side view).
Figure 3.
Figure 3.
Comparison of glycine, DCS, and glutamate binding, with models aligned by D1 domains of NR1 and NR2. A, Molecular dynamics simulation with glycine (orange) or DCS (green) in the binding pocket for NR1/NR2B and NR1/NR2C receptors. The α-carboxy group of glycine interacts with the guanidinium group of Arg523 through a salt-bridge in both NR1/NR2B and NR1/NR2C MD simulations. B, Molecular dynamics simulations show the interactions of glutamate within the binding pocket with either glycine (orange) or DCS (green) in the NR1 binding pocket.
Figure 4.
Figure 4.
A representation of the net displacement observed for the center of mass of the D2 domains for both the NR1 and NR2 subunit at the conclusion of the simulations. To determine the displacement of the D2 domains, the average structure of the last 2 ns of the 10 ns Molecular dynamics simulations were aligned to the starting structures based on the D1 domain of both the NR1 and NR2 subunit. A, The spheres are representative of the center of mass of the D2 domain of the NR1 subunit. The sphere in light blue represents the center of mass of the starting structure of NR1/NR2B and the dark blue that of NR1/NR2C; the starting structure reflects the position of D2 in the NR1/NR2A crystal structure from which NR1/NR2B and NR1/NR2C homology models were built. The NR1 simulations with Gly are represented in orange and that of DCS in green. The black spheres are representative of the center of mass displacement of the D2 domains of a NR1(R755A)/NR2C mutant, simulated in the presence of DCS and Glu. The shaded area highlights the similar displacement at the end of the simulation for the most efficacious agonist for both NR1/NR2B (glycine) and NR1/NR2C (DCS). B, The spheres are representative of the center of mass of the D2 domain of the NR2 subunit. The same color scheme as in A. The net displacement on the x-, y-, and z-axis are presented in the table below. The orientation of the axis can be found in the top right-hand corner.
Figure 5.
Figure 5.
Residues at the dimer interface play a role in the control of the relative efficacy of DCS. A, Hydrogen bond formation between residues Arg755, Glu803 and Glu541 illustrating the dimer interface interaction, which correlates domain movement between the D2 domains of NR1 and NR2. Left, The NR2C subunit is colored lime and light orange for the DCS and glycine, respectively. Right, The NR1 subunit is colored green and orange with Arg755 protruding from the NR1–D2 domain interacting with Glu803 and Glu541 from the NR2C-D2 domain. The orientation change Phe754 undergoes between the DCS and glycine simulations can be observed on β-strand 14. Gln800 is shown protruding from helix K, no hydrogen bond formation with Tyr692 and Phe754 was observed. B, Hydrogen bond formation between residues Arg755, Glu793 and Glu531 illustrating the dimer interface interaction, which correlates movement between the D2 domains of NR1 and NR2. Left, The NR2B subunit is colored lime and light orange for the DCS and glycine, respectively. Right, The NR1 subunit is colored green (DCS) and orange (glycine) with Arg755 protruding from the NR1–D2 domain interacting with Glu793 and Glu531 from the NR2B-D2 domain. Glu790 protrudes from helix K to form hydrogen bonds with Tyr692 and the Phe754. C, Summary of changes in relative efficacy; efficacy between wild type and respective mutant receptors was compared by unpaired t test; **p < 0.01, ***p < 0.001. The fitted EC50 values are presented in Table 1.
Figure 6.
Figure 6.
Structural rearrangements at dimer interface involving helix J of NR1 and both helices F and D of NR2. A, Molecular dynamics simulations showed polar interactions between NR1-Glu781 and both helices D and F of NR2C. The γ-carboxyl group of NR1-Glu781 interacts with NR2C-Arg703 whereas its backbone carbonyl group interacts with NR2C-Asn704 in both the DCS and Gly simulations. In addition Arg703 of helix F also interacts with NR2C-Glu527 of helix D in both simulations. B, In the NR2B simulations the backbone carbonyl group of NR1-Glu781 interacts with the NR2B-Asn694 of helix F in both simulations. The γ-carboxyl group of NR1-Glu781 interacts with NR2B-Arg693 in the DCS simulation, which in turn interacts with NR2B-Glu517 of helix D. The latter was however not observed in the glycine simulation. C, Mutation of NR1-Glu781 to Ala reduced the relative efficacy of DCS. The DCS relative efficacy was 149 ± 10% and 10 ± 1% at NR1(E781A)/NR2C and NR1(E781A)/NR2B, respectively (n = 8). There was no significant change in EC50 for DCS or glycine activation of NR1(E781A)/NR2C or NR1(E781A)/NR2B (see Table 1).
Figure 7.
Figure 7.
DCS increases the mean open time and open probability of NR1/NR2C receptors. A, Steady-state recordings of NR1/NR2C unitary currents from an outside-out patch that contained one active channel in the presence of maximally effective concentration of glutamate and glycine or DCS (1 mm glutamate, 1 mm glycine or 1 mm DCS; VHOLD −80 mV, digitized at 40 kHz, filtered at 5–8 kHz, −3 dB) under two different time scales showing the increase in open probability and mean open time of the channel. B, Paired recordings in glycine and DCS in which we observed only one active channel were analyzed by time course fitting analysis using SCAN software (see Materials and Methods). The mean open time of NR1/NR2C receptors was increased by 131 ± 4% in the presence of DCS (n = 6, ***p < 0.001, paired t test). The open probability was increased by 194 ± 33% in the presence of DCS (n = 6, *p < 0.05, paired t test). C, The composite open time histogram from 6 patches was fitted by two exponential components [glycine: n = 6 patches, 11,275 open periods, τ1 = 0.32 ms (64%), τ2 = 0.68 ms (36%) and DCS: n = 6 patches, 16,662 open periods, τ1 = 0.32 ms (49%), τ2 = 0.76 ms (51%)]. The composite shut time histogram from 6 patches was fitted by five exponential components [glycine: n = 6 patches, 11,272 closed periods, τ1 = 0.042 ms (18%), τ2 = 0.36 ms (7%), τ3 = 9.1 (29%), τ4 = 32 ms (43%) and τ5 = 138 ms (3%) and DCS: n = 6 patches, 16,657 closed periods, τ1 = 0.037 ms (19%), τ2 = 0.48 ms (10%), τ3 = 9.5 ms (36%), τ4 = 36 ms (32%) and τ5 = 248 ms (3%)].
Figure 8.
Figure 8.
DCS augments a fast gating step in NR1/NR2C activation. A, A linear model of NR1/NR2C receptor activation is shown (Dravid et al., 2008); all ligand binding steps are omitted, and all states are assumed to be liganded. The forward rate (k2+) was significantly augmented by DCS whereas the closing rate k3− was significantly slowed by DCS. B, MIL fit of single-channel data (idealized using SCAN) with Scheme 1 is shown. The representative recording from one patch contained a total of 2917 and 5128 open durations; 2916 and 5127 shut durations; an open probability of 0.021 and 0.026 and apparent mean open time of 0.46 ms and 0.52 ms in glycine and DCS, respectively (imposed resolution of 50 μs for open period and 30 μs for shut period). The rate constant k2+ for this particular patch was 1386 s−1 in glycine and 2150 s−1 in DCS and rate constant k3− was 2614 s−1 in glycine and 2388 s−1 in DCS. C, Free-energy relationship plot normalized to RA2a state was obtained using QUB. The desensitized states were excluded. Scale bar is 20 kJ mol−1. DCS reduced the height of the second activation barrier (RA2b to RA2c).
Figure 9.
Figure 9.
Least-squares fitting of NR1/NR2C activation model to macroscopic currents. A, Scheme 1a is an extension of Scheme 1 with explicit glutamate binding steps. B, The long and brief current responses were fitted simultaneously for each agonist as described in Materials and Methods (see also Erreger et al., 2005a). Only the binding, unbinding and desensitization rates were allowed to vary. The fitted rate constants are presented in Table 3. Scheme 1a was able to describe the main features of the macroscopic current response.

Similar articles

Cited by

References

    1. Albouy R, Eloy P, Pestel M, Ravina A, Rey M. First clinical results obtained with cycloserine in the treatment of human tuberculosis. Antibiot Annu. 1955;3:148–152. - PubMed
    1. Auerbach A, Zhou Y. Gating reaction mechanisms for NMDA receptor channels. J Neurosci. 2005;25:7914–7923. - PMC - PubMed
    1. Banke TG, Traynelis SF. Activation of NR1/NR2B NMDA receptors. Nat Neurosci. 2003;6:144–152. - PubMed
    1. Banke TG, Dravid SM, Traynelis SF. Protons trap NR1/NR2B NMDA receptors in a nonconducting state. J Neurosci. 2005;25:42–51. - PMC - PubMed
    1. Benveniste M, Mayer ML. Kinetic analysis of antagonist action at N-methyl-d-aspartic acid receptros: two binding sites each for glutamate and glycine. Biophys J. 1991;59:560–573. - PMC - PubMed

Publication types

MeSH terms

LinkOut - more resources