. 2010 Feb 17;30(7):2755-66.
doi: 10.1523/JNEUROSCI.4218-09.2010.

Coordination between extrinsic extracellular matrix cues and intrinsic responses to orient the centrosome in polarizing cerebellar granule neurons

Affiliations

Coordination between extrinsic extracellular matrix cues and intrinsic responses to orient the centrosome in polarizing cerebellar granule neurons

Shailesh Kumar Gupta et al. J Neurosci. .

Abstract

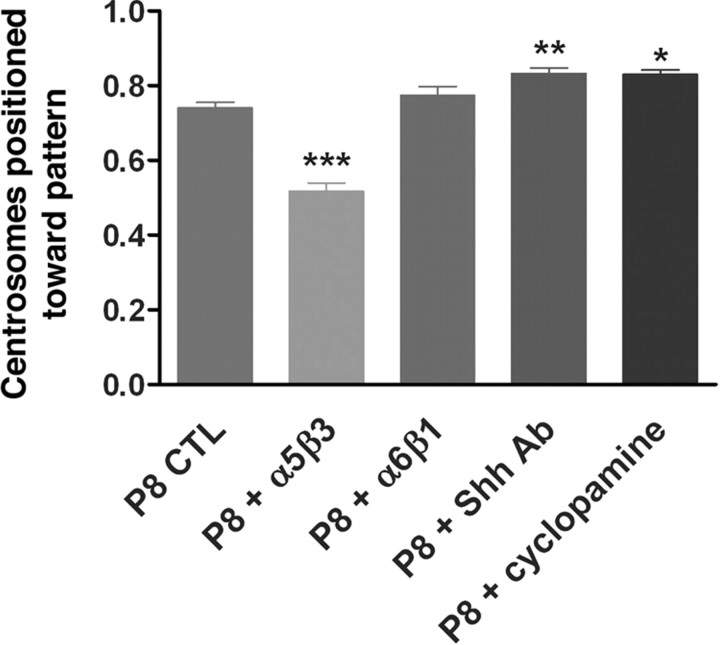
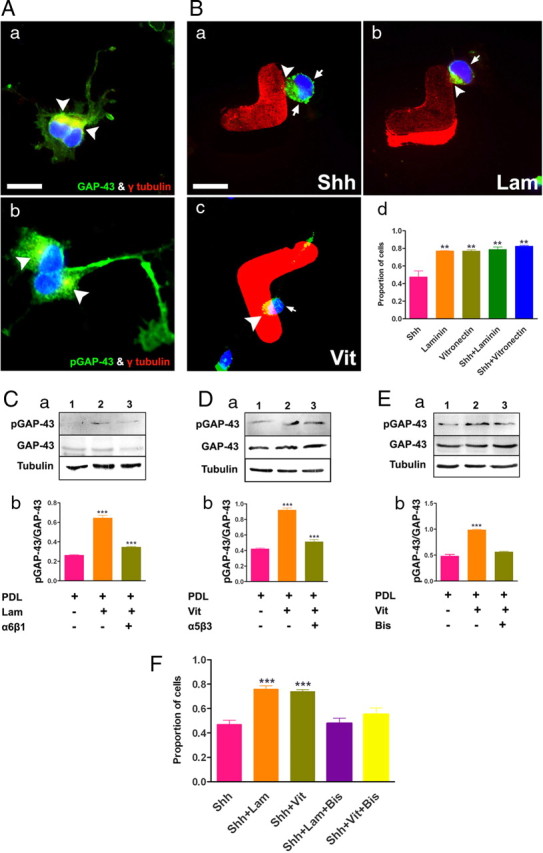
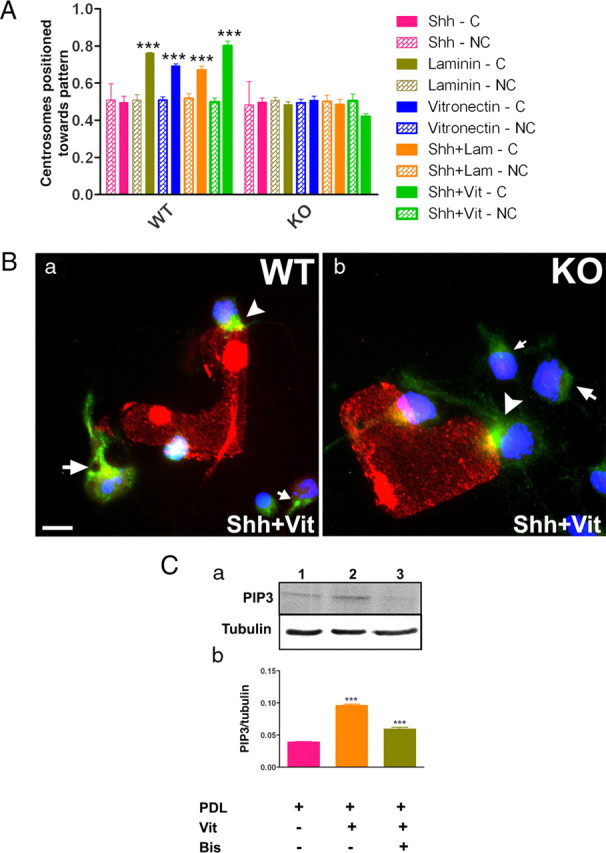
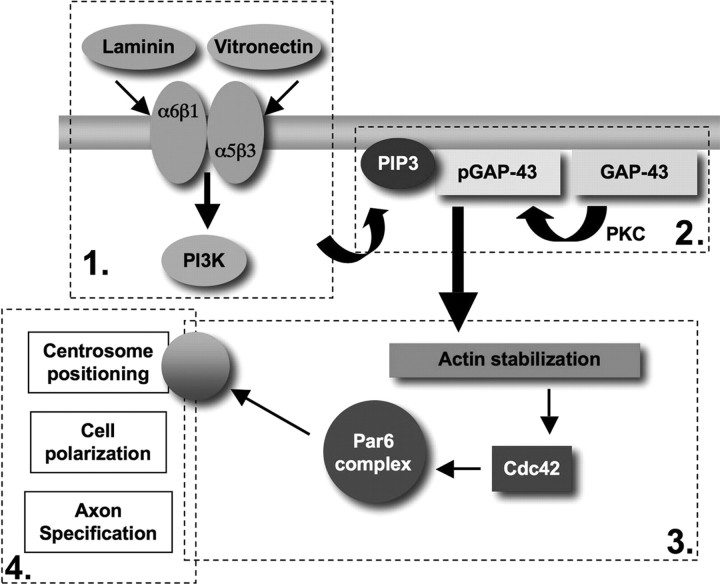
Successful axon targeting during development is critically dependent on directionality of axon extension and requires coordination between the extrinsic cues that provide spatial information to the axon and the intrinsic responses that regulate structural specification of the axon during neuronal polarization. How these responses are coordinated is unclear but are known to involve aligning the centrosome with the base of the emerging axon. We have used a novel in vitro micropatterning assay that spatially segregates the extrinsic cues used by polarizing cerebellar granule cells to orient axon extension and used it to investigate the signaling mechanisms responsible for coordinating centrosome positioning with intrinsic responses. The results show that, when laminin and/or vitronectin are used as spatially restricted cues in association with substrate-associated sonic hedgehog, they are sufficient to induce cell cycle arrest, that laminin and vitronectin then induce integrin-mediated signaling that upregulates phosphoinositide-3 kinase and PKC function to produce phosphatidylinositol 3,4,5-trisphosphate (PIP3) that is associated with the centrosome, that this PIP3 can interact with PKC-phosphorylated growth-associated protein GAP-43, and that PKC-phosphorylated GAP-43 in turn is required for positioning Par6, Cdc42, and IQGAP1, all intrinsic response components, in proximity to the centrosome, such that, in the absence of GAP-43, they are mislocalized and microtubules are not oriented appropriately. We conclude from these results that GAP-43 plays an important role in coordinating extrinsic signaling and intrinsic responses in polarizing cerebellar granule neurons.


Figures

Figure 1.
Figure 1.
Laminin and vitronectin expression in mouse cerebellar cortex. Left, Sagittal section of P0 cerebellum showing laminin (a, e) (lam) and vitronectin (c, g) (vit) immunoreactivity in green and DAPI labeling of nuclei for identification of cerebellar layers in blue. Right, Sagittal section of P8 cerebellum showing laminin (b, i) and vitronectin (d, k) immunoreactivity in green and DAPI labeling of nuclei for identification of cerebellar layers in blue. oEGL, outer EGL; iEGL, inner EGL. Scale bar: a–c, 50 μm; d, 25 μm.
Figure 2.
Figure 2.
Laminin (Lam) and vitronectin (Vit) but not Shh can position the centrosome. A, Schema of centrosome orientation analysis. The central red “L” shape represents one printed protein pattern. a–c, Contact cells. a, Centrosome positioned toward the pattern; b, c, centrosome not positioned toward the pattern. d, e, Noncontact cells. d, Centrosome positioned toward the pattern; e, centrosome not positioned toward the pattern. B, Immunoreactivity of cells plated on vitronectin pattern (red) showing γ-tubulin labeling of centrosome (green). Arrowhead depicts contact cell with centrosome positioned toward pattern. Scale bar, 8 μm. C, Proportion of P0 and P8 granule cells with centrosomes positioned toward Shh, laminin, vitronectin, Shh plus laminin, and Shh plus vitronectin patterns. Data are mean ± SEM from five independent experiments (≥400 cells were counted in each experiment). ***p < 0.001 indicates significant difference compared with the Shh condition within each age (one-way ANOVA with post hoc Dunnett's test). Variation attributable to age was not significant (two-way ANOVA). D, Immunoreactivity of proliferating cells labeled with BrdU (green) on Shh (a), Shh plus laminin (b), and Shh + vitronectin printed patterns (c) (red). Scale bar, 25 μm. E, Percentage of proliferating contact cells (C) and noncontact cells (NC) on Shh, Shh plus laminin, and Shh plus vitronectin printed patterns. Data are mean ± SEM from three independent experiments (≥200 cells were counted in each experiment). ***p < 0.001 indicates significant difference between BrdU-positive contact and noncontact cells under each condition (one-way ANOVA with post hoc Dunnett's test).
Figure 3.
Figure 3.
Inhibiting laminin (Lam) and vitronectin (Vit) prevents centrosome positioning in slice cultures. A, Confocal micrographs of P8 cerebellar slice cultures labeled with anti-γ-tubulin to detect centrosomes (green). a, Control. b–d, In the presence of blocking antibodies (Ab): b, anti-laminin; c, anti-Shh; d, anti-vitronectin. e, In the presence of 5 nm cyclopamine (Cyclo). Arrowheads, Type I cells with centrosomes positioned at the base of the primary axon. Arrows, Type II cells with centrosomes not positioned at the base of the primary axon. Scale bar, 25 μm. B, Proportion of type I cells compared with control (CTL) for each condition. Data are mean ± SEM from ≥3 independent experiments (≥200 cells were counted in each experiment). ***p < 0.001 indicates significant differences between treated and control cells (one-way ANOVA with post hoc Dunnett's test).
Figure 4.
Figure 4.
Laminin and vitronectin require cognate integrin receptors to position the centrosome. Proportion of P8 granule cells with centrosomes positioned toward Shh plus vitronectin protein pattern (P8 CTL) or in presence of anti-vitronectin receptor antibody anti-α5β3 (P8 + α5β3), anti-laminin receptor antibody anti-α6β1 (P8 + α6β1), anti-Shh antibody (P8 + Shh Ab), or cyclopamine (P8 + cyclopamine). Data are mean ± SEM of ≥4 independent experiments (≥400 cells were counted in each experiment). *p < 0.05, **p < 0.01, and ***p < 0.001 indicate significant differences compared with control (one-way ANOVA with post hoc Dunnett's test).
Figure 5.
Figure 5.
Laminin and vitronectin require upregulation of PI3K to position the centrosome. A, Influence of laminin (Lam). a, Representative Western blot from P8 granule cells after 48 h of culture probed with anti-PI3K, pAKT, AKT, and tubulin. Lane 1, PDL; lane 2, PDL plus laminin; lane 3, PDL plus laminin in the presence of laminin receptor blocking antibody α6β1. b, Quantitation of PI3K immunoreactivity (normalized relative optical densities) compared with total tubulin. c, Quantitation of pAKT immunoreactivity normalized to total AKT. Data are mean ± SEM from four independent experiments. ***p < 0.001 indicates significant difference compared with control (PDL) (one-way ANOVA with post hoc Dunnett's test). B, Influence of vitronectin (Vit). a, Representative Western blot from P8 granule cells after 48 h of culture probed with anti-PI3K, pAKT, AKT, and tubulin. Lane 1, PDL; lane 2, PDL plus vitronectin; lane 3, PDL plus vitronectin in the presence of vitronectin receptor blocking antibody α5β3. b, Quantitation of PI3K immunoreactivity (normalized relative optical densities) compared with tubulin. c, Quantitation of pAKT immunoreactivity normalized to total AKT. Data are mean ± SEM from four independent experiments. ***p < 0.001 indicates significant difference compared with control (PDL) (one-way ANOVA with post hoc Dunnett's test). C, Proportion of P8 granule cells with centrosomes positioned toward Shh, Shh plus laminin, Shh plus vitronectin, Shh plus laminin with 200 nm wortmanin (Wort), and Shh plus vitronectin with 200 nm wortmanin. Data are mean ± SEM of ≥4 independent experiments (≥400 cells were counted in each experiment). ***p < 0.001 indicates significant differences compared with control (one-way ANOVA with post hoc Dunnett's test). D, PI3K (green) immunoreactivity (arrowheads) in P0 cerebellar granule cells plated on Shh (a) (red), Shh plus laminin (b), and Shh plus vitronectin (c) microcontact printed patterns. Scale bar, 8 μm. E, PIP3 (green) immunoreactivity in P0 cerebellar granule cells plated on Shh plus vitronectin microcontact printed pattern. Arrowhead indicates PIP3 immunoreactivity, whereas arrow indicates region of minimal PIP3 immunoreactivity. Scale bar, 8 μm.
Figure 6.
Figure 6.
Laminin (Lam) and vitronectin (Vit) require phosphorylated GAP-43 to position the centrosome. A, P0 granule neurons labeled with GAP-43 (green) and γ-tubulin (red) (a) and labeled with pGAP-43 (green) and γ-tubulin (red) (b). Arrowheads shows region in which GAP-43 and pGAP-43 are coexpressed with γ-tubulin. Scale bar, 8 μm. B, GAP-43 (green) immunoreactivity in P0 cerebellar granule cells plated on Shh (a) (red), laminin (b) (red), and vitronectin (c) (red) microcontact printed patterns. Arrowheads indicate pGAP-43 expression in the region of cell contact, whereas arrow indicates pGAP-43 expression in the region not in contact. Scale bar, 8 μm. d, Proportion of cells with pGAP-43 immunoreactivity positioned toward Shh, laminin, Shh plus laminin, vitronectin, and Shh plus vitronectin protein patterns. Data are mean ± SEM from three independent experiments (≥100 cells were counted in each experiment). **p < 0.01 indicates significant difference in pGAP-43 localization compared with Shh values (one-way ANOVA with post hoc Dunnett's test). C, Influence of laminin. a, Representative Western blot from P8 granule cells after 48 h of culture probed with anti-pGAP-43, GAP-43, and tubulin. Lane 1, PDL; lane 2, PDL plus laminin; lane 3, PDL plus laminin in the presence of laminin receptor blocking antibody anti-α6β1. b, Quantitation of pGAP-43 immunoreactivity (normalized relative optical densities) compared with GAP-43. Data are mean ± SEM from four independent experiments. ***p < 0.001 indicates significant difference compared with control (PDL) (one-way ANOVA with post hoc Dunnett's test). D, Influence of vitronectin. a, Representative Western blot from P8 granule cells after 48 h of culture probed with anti-pGAP-43, GAP-43, and tubulin. Lane 1, PDL; lane 2, PDL plus vitronectin; lane 3, PDL plus vitronectin in the presence of laminin receptor blocking antibody anti-α5β3. b, Quantitation of pGAP-43 immunoreactivity (normalized relative optical densities) compared with GAP-43. Data are mean ± SEM from four independent experiments. ***p < 0.001 indicates significant difference compared with control (PDL) (one-way ANOVA with post hoc Dunnett's test). E, PKC inhibition. Representative Western blot from P8 granule cells after 48 h of culture probed with anti-pGAP-43, GAP-43, and tubulin (a). Lane 1, PDL; lane 2, PDL plus vitronectin; lane 3, PDL in the presence of 500 nm bisindolylmaleimide (Bis.). b, Quantitation of pGAP-43 immunoreactivity (normalized relative optical densities) compared with GAP-43. Data are mean ± SEM from four independent experiments. ***p < 0.001 indicates significant difference compared to control (PDL) (one-way ANOVA with post hoc Dunnett's test). F, Proportion of P8 granule cells with centrosomes positioned toward Shh, Shh plus laminin, Shh plus vitronectin, Shh plus laminin with 500 nm bisindolylmaleimide, and Shh plus vitronectin with 500 nm bisindolylmaleimide. Data are mean ± SEM of ≥4 independent experiments (≥400 cells were counted in each experiment). ***p < 0.001 indicates significant differences compared with Shh (one-way ANOVA with post hoc Dunnett's test).
Figure 7.
Figure 7.
Phosphorylated GAP-43 interacts with PIP2 and PIP3. A, P8 granule cells labeled with GAP-43 (a) (red) and PIP3 (b) (green). c, Merged images to show colocalization. Scale bar, 8 μm. B, Phospholipid binding. a, Membrane phospholipids incubated with pure GAP-43 and then probed with antibodies that recognize total GAP-43 (7B10) and pGAP-43 (2G12). b, Quantitation of the fold increase in GAP-43 (black bar) and pGAP-43 (gray bar) immunoreactivity (normalized relative optical densities) compared with blank control. Data are mean ± SEM from three (n = 3) independent experiments. ***p < 0.001 indicates significant differences compared with Sphingosine-1-phosphate (SIP) (one-way ANOVA with post hoc Dunnett's test).
Figure 8.
Figure 8.
GAP-43 is required for positioning centrosomes but not for PIP3 localization, but PIP3 upregulation is dependent on PKC. A, Proportion of P0 GAP-43 +/+ and GAP-43 −/− granule cells with centrosomes positioned toward Shh, laminin, vitronectin, Shh plus laminin, Shh plus vitronectin, and Shh plus laminin protein patterns. Data are mean ± SEM of ≥4 independent experiments (≥400 cells were counted in each experiment). ***p < 0.001 indicates significant differences compared with noncontact cell values (one-way ANOVA with post hoc Dunnett's test). B, PIP3 localization (green) in P0 granule cells plated on Shh plus vitronectin pattern labeled with anti-Shh (red). a, GAP-43 +/+; b, GAP-43 −/−. Arrowhead points to the region of the cell in contact with the protein pattern, and arrow points to the base of the primary process in cells not in contact with the pattern. C, a, Western blot probed with PIP3 and tubulin antibody after 48 h of P8 cerebellar granule neurons cultured on PDL (lane 1), PDL plus vitronectin (lane 2), and PDL plus vitronectin in the presence of bisindolylmaleimide (Bis.) (lane 3). b, Quantitation of PIP3 normalized to total tubulin after 48 h of culture. Western blot shown is a representative blot. Bars in Western blot analysis represent normalized relative optical densities plotted as mean ± SEM calculated from three (n = 3) independent experiments. ***p < 0.001 indicates significant difference from control (PDL) (one-way ANOVA with Dunnett's test compared with PDL values). KO, Knock-out; WT, wild type; C, contact; NC, noncontact.
Figure 9.
Figure 9.
GAP-43 is required for localization of cytoskeletal polarity regulators and their ability to position the centrosome. A, Effect of acutely inhibiting GAP-43 expression on localization of Cdc42 (red) in P0 granule cells. a, Control–EGFP construct (green). b, GAP-43 shRNA–EGFP (green). Arrowhead points to the base of the primary process. Scale bar, 8 μm. B, Effect of acutely inhibiting GAP-43 expression on localization of Par6 (red) in P0 granule cells. a, Control–EGFP construct (green). b, GAP-43 shRNA–EGFP (green). Arrowhead points to the base of the primary process. Representative images from n ≥ 25 cells from three independent experiments. Scale bar, 8 μm. C, Immunoreactivity of Cdc42 (green) and IQGAP1 (red) in P0 granule cells. a, b, GAP-43 +/+; c–e, GAP-43 −/−. Arrowheads indicate regions in which Cdc42 and IQGAP1 are colocalized at the base of the primary process. Arrow in c indicates region in which only IQGAP1 is localized. Arrow in d and e indicates region in which Cdc42 and IQGAP1 are colocalized but not at the base of the primary process. Representative images from n ≥ 50 cells from three independent experiments. Scale bar, 8 μm. D, Immunoreactivity of α-tubulin (green) and Shh (red) in P0 granule cells Shh plus vitronectin protein pattern. a, GAP-43 +/+; b, P0 GAP-43 −/−. Arrowhead in a indicates direction of tubulin polymerization associated with the point of contact with the pattern. Arrowhead in b indicates the point of contact with the pattern, and arrow in b indicates that the direction of tubulin polymerization is not associated with the point of contact. Representative images from n ≥ 50 cells from three independent experiments. Scale bar, 8 μm. KO, Knock-out; WT, wild type.
Figure 10.
Figure 10.
Model, ECM molecules laminin and vitronectin can orient the centrosome. Summary model of laminin and vitronectin influence on centrosome positioning and polarity establishment in differentiating cerebellar granule neurons. We have identified three distinct stages in signal transduction. 1, Membrane proximal signal transduction by laminin and vitronectin: activation of cognate integrin receptors, upregulation of PI3K, pAKT, and PIP3. 2, Membrane-mediated coordination between extrinsic signaling and intrinsic responses: phosphorylation of membrane-associated GAP-43 by PKC, selective binding of pGAP-43 to PIP3. 3, Intrinsic responses mediated by actin-regulatory molecules: association of Cdc42, Par6 complex, and IQGAP1 with the centrosome. 4, Centrosome positioning at the base of the leading process and microtubule-mediated responses. GAP-43 is required for 3 and 4 but not for 1 and 2, suggesting that it acts to coordinate extrinsic signaling with intrinsic responses.

Similar articles

Cited by

References

    1. Alberts P, Rudge R, Irinopoulou T, Danglot L, Gauthier-Rouvière C, Galli T. Cdc42 and actin control polarized expression of TI-VAMP vesicles to neuronal growth cones and their fusion with the plasma membrane. Mol Biol Cell. 2006;17:1194–1203. - PMC - PubMed
    1. Blaess S, Graus-Porta D, Belvindrah R, Radakovits R, Pons S, Littlewood-Evans A, Senften M, Guo H, Li Y, Miner JH, Reichardt LF, Müller U. Beta1-integrins are critical for cerebellar granule cell precursor proliferation. J Neurosci. 2004;24:3402–3412. - PMC - PubMed
    1. Calderon de Anda F, Gärtner A, Tsai LH, Dotti CG. Pyramidal neuron polarity axis is defined at the bipolar stage. J Cell Sci. 2008;121:178–185. - PubMed
    1. Changelian PS, Meiri K, Soppet D, Valenza H, Loewy A, Willard M. Purification of the growth-associated protein GAP-43 by reversed phase chromatography: amino acid sequence analysis and cDNA identification. Brain Res. 1990;510:259–268. - PubMed
    1. Chen L, Liao G, Yang L, Campbell K, Nakafuku M, Kuan CY, Zheng Y. Cdc42 deficiency causes Sonic hedgehog-independent holoprosencephaly. Proc Natl Acad Sci U S A. 2006a;103:16520–16525. - PMC - PubMed

Publication types

MeSH terms

LinkOut - more resources