. 2010 Feb 17;30(7):2767-82.
doi: 10.1523/JNEUROSCI.3959-09.2010.

Phase response curve analysis of a full morphological globus pallidus neuron model reveals distinct perisomatic and dendritic modes of synaptic integration

Affiliations

Phase response curve analysis of a full morphological globus pallidus neuron model reveals distinct perisomatic and dendritic modes of synaptic integration

Nathan W Schultheiss et al. J Neurosci. .

Abstract

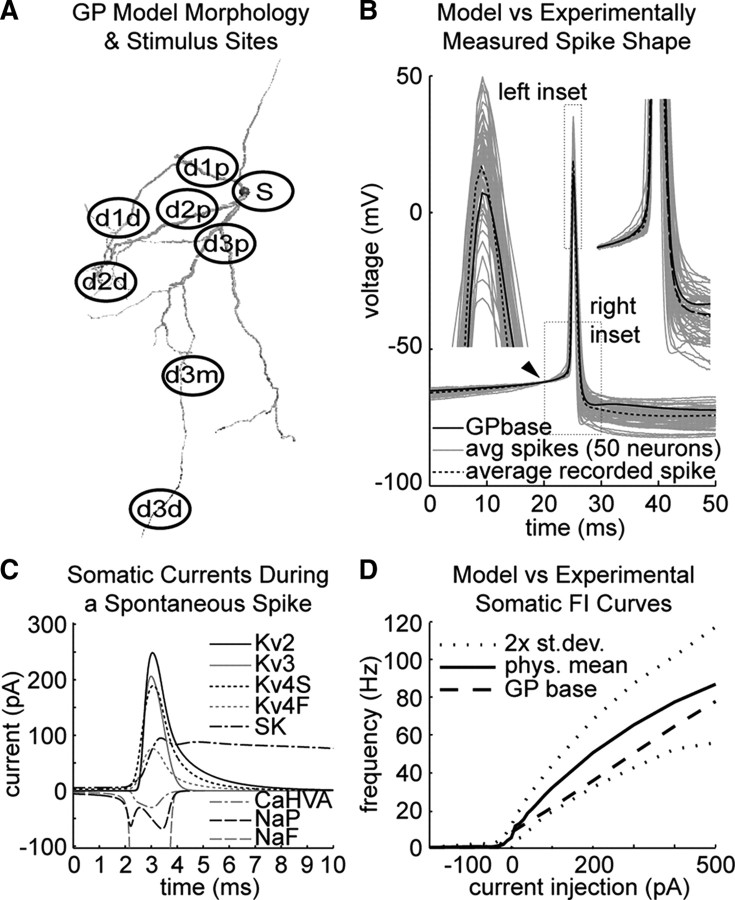
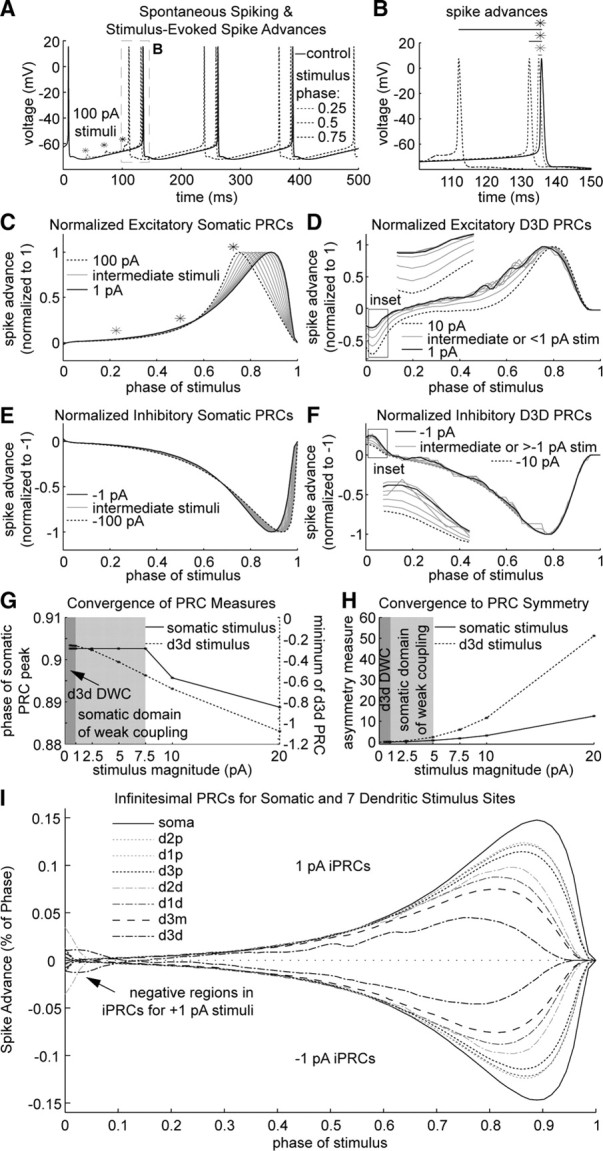
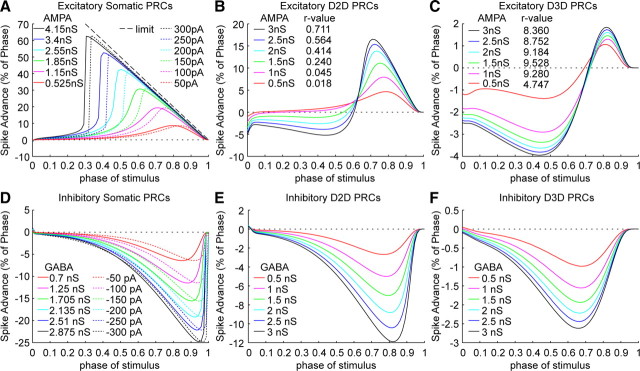
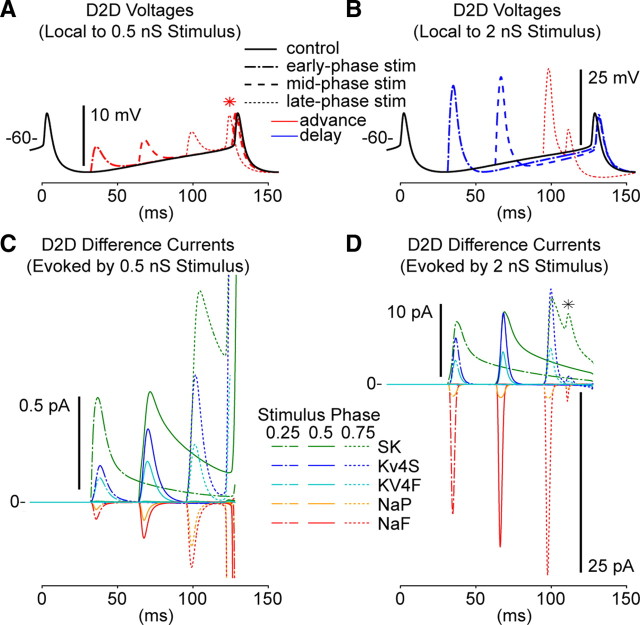
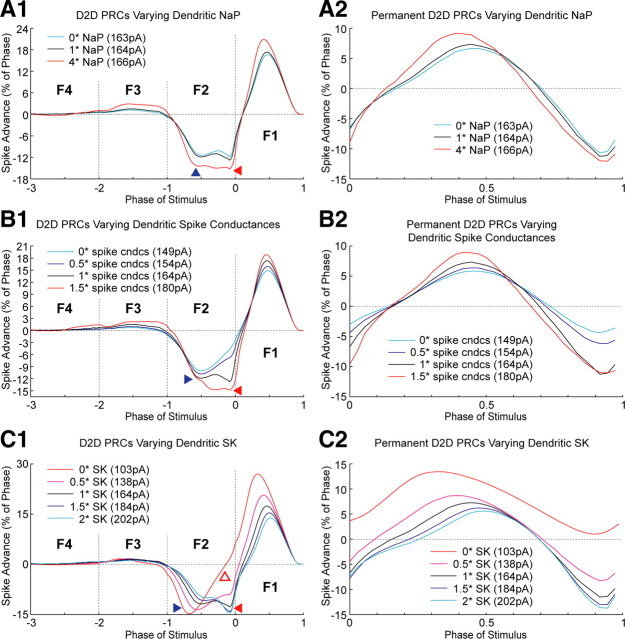
Synchronization of globus pallidus (GP) neurons and cortically entrained oscillations between GP and other basal ganglia nuclei are key features of the pathophysiology of Parkinson's disease. Phase response curves (PRCs), which tabulate the effects of phasic inputs within a neuron's spike cycle on output spike timing, are efficient tools for predicting the emergence of synchronization in neuronal networks and entrainment to periodic input. In this study we apply physiologically realistic synaptic conductance inputs to a full morphological GP neuron model to determine the phase response properties of the soma and different regions of the dendritic tree. We find that perisomatic excitatory inputs delivered throughout the interspike interval advance the phase of the spontaneous spike cycle yielding a type I PRC. In contrast, we demonstrate that distal dendritic excitatory inputs can either delay or advance the next spike depending on whether they occur early or late in the spike cycle. We find this latter pattern of responses, summarized by a biphasic (type II) PRC, was a consequence of dendritic activation of the small conductance calcium-activated potassium current, SK. We also evaluate the spike-frequency dependence of somatic and dendritic PRC shapes, and we demonstrate the robustness of our results to variations of conductance densities, distributions, and kinetic parameters. We conclude that the distal dendrite of GP neurons embodies a distinct dynamical subsystem that could promote synchronization of pallidal networks to excitatory inputs. These results highlight the need to consider different effects of perisomatic and dendritic inputs in the control of network behavior.


Figures

Figure 1.
Figure 1.
GP model morphology, conductances, and electrophysiological properties reproduce those of recorded GP neurons. A, Neurolucida (MicroBrightField) reconstruction of the GP neuron morphology used for all versions of the GP model. Somatic (S) and proximal, mid, and distal dendritic stimulus locations for PRC analysis are indicated by oval labels. B, Matching of model spike shapes to physiological recordings. The model spike trace (solid line) matched the average recorded spontaneous spike trace (dashed line) well within the biological variability (gray lines) for of spike onset, spike height, and spike width, and AHPs. Average spikes from 50 recorded neurons (gray lines) are anchored to the population mean voltage 5 ms before spike peaks (black arrowhead) to illustrate the variability of AHPs across neurons. C, Somatic voltage- and calcium-gated currents during a spontaneous action potential of GPbase. Note that the NaF current peak is curtailed by the x-axis to better distinguish the other current traces. H-current is not shown because it had minimal activation. D, Frequency-current (FI) curves for the base model compared with the average experimentally measured FI curve.
Figure 2.
Figure 2.
Physiologically realistic inputs to GP are outside somatic and dendritic domains of weak coupling. A, Voltage traces illustrating spontaneous 7.9 Hz spiking of the model and voltage deflections and spike advances elicited by 100 pA somatic stimuli delivered at one of three points in phase (indicated by asterisks). Note, spike advances persist indefinitely (3 spike cycles shown). B, Expansion of A highlighting spike advances resulting from stimuli delivered at different phases. The earliest stimulus (indicated in A–C by the lightest gray asterisk) yields the smallest spike advance, and the latest (black asterisk) yields the largest. C, Normalized PRCs for somatic current injections between 1 pA (solid black line) and 100 pA (dotted black line). Larger somatic stimuli yield PRCs with peaks occurring earlier in phase. The shape of normalized somatic PRCs converges for stimuli weaker than 7.5 pA. D, Normalized PRCs derived by stimulating the distal region of dendrite 3 (D3D) with current pulses between 0.5 pA and 10 pA (dotted black line). The shape of normalized D3D PRCs converges for stimuli ≤1 pA (solid black line) with an r-value of 0.0675 indicating that the iPRC for D3D is type I. This can be seen most readily by examining the negative peaks of these PRCs occurring at a phase of ∼0.025 (box and inset). E, Normalized PRCs for negative somatic current injections between −1 pA (solid black line) and −100 pA (dotted black line). Larger negative stimuli yield PRCs with more right-shifted peaks. Note by comparison to C, 1 pA and −1 pA somatic PRCs are symmetrical across zero. F, Normalized PRCs for D3D current injections between −0.5 pA and −10 pA (dotted black line). The shapes of these normalized D3D PRCs converge for stimuli of or greater than −1 pA (solid black line). This can be seen most readily by noting the positive peaks of PRCs at a phase of ∼0.025 (box and inset). G, Domains of somatic and D3D weak coupling illustrated by plotting the relationships between features of the PRCs and stimulus strength. For somatic current injections of 7.5 pA or less, the phase at which the peak of PRCs occurs (left y-axis) has converged. For D3D current injections of 1 pA or less, the negative peak of PRCs (right y-axis) has converged. H, Domains of somatic and D3D weak coupling illustrated by plotting a measure of PRC asymmetry (obtained by summing together PRCs for positive and negative current injections of equal magnitude at all points in phase) against stimulus strength. Excitatory somatic PRCs for stimulus strengths >5 pA are increasingly asymmetric with inhibitory somatic PRCs of equal strengths. Excitatory D3D PRCs for stimulus strengths >1 pA are increasingly asymmetric with inhibitory D3D PRCs of equal strengths. I, Infinitesimal PRCs (1 pA and −1 pA) for all stimulus locations are type I.
Figure 3.
Figure 3.
PRC shape depends both on stimulus location and strength. A, Somatic PRCs are always type I for square-pulse positive current injections and for simulated excitatory synaptic AMPA conductances. Somatic PRCs have peaks that scale approximately linearly with stimulus magnitude, and larger stimuli cause more of the late-phase PRC to approach the limit of spike advancement. B, Small excitatory synaptic inputs to the end of a shorter dendrite (D2D) yield type I PRCs, however, larger inputs to D2D yield PRCs of increasing type II character. Both positive and negative peaks of D2D PRCs increase in size with stimulus strength. C, Excitatory synaptic inputs to the end of the longest dendrite (D3D) yielded type II PRCs for all input strengths tested in this set of experiments. D, Somatic PRCs are always type I for square-pulse negative current injections and for simulated inhibitory GABAA synaptic conductances. E, F, Distal dendritic PRCs for inhibitory synaptic input (to D2D in E; to D3D in F) are type I.
Figure 4.
Figure 4.
Different input strengths evoke different contingents of membrane currents at the distal dendrite. Shown are stimulus-evoked voltage and current transients for 0.5 nS and 2 nS excitatory inputs to D2D. A, Voltage deflections elicited by 0.5 nS excitatory synaptic input to D2D at phases of 0.25, 0.5, or 0.75 (red dashed lines, indicating phase advances). Importantly, these stimuli yield a type I D2D PRC. The unstimulated voltage trajectory at D2D (black trace) illustrates the back-attenuated voltage oscillation driven by spontaneous axosomatic spiking. Small spike advancements are evident in the stimulated D2D voltage traces relative to the control trace (red *), particularly for the late-phase stimulus. B, Voltage deflections elicited by 2 nS excitatory synaptic input to D2D at phases of 0.25, 0.5, or 0.75 (dashed blue or red lines, indicating phase delays or advances, respectively). Importantly, these stimuli yield a type II D2D PRC. C, Difference currents (IDiff) local to 0.5 nS D2D stimuli were calculated by the subtraction of control current traces from stimulated current traces. The five largest difference currents are shown, and of these, IDiff-SK (green traces) is both the largest and longest lasting. Only slight differences are evident in the currents evoked by stimuli at difference phases (here, and in D), because the control voltage trajectory at D2D is relatively flat. Note that for visual clarity, IDiff traces in C are curtailed at the time of the next spike. D, Difference currents local to 2 nS D2D stimuli. A fourfold increase in input strength (compared with C) yields a much larger transient increase in IDiff-NaF which amplifies the voltage deflection (red traces) and a 20-fold increase in peak IDiff-SK (green traces). Note that the spike advancement caused by the late-phase stimulus results in a second peak in IDiff-SK (*).
Figure 5.
Figure 5.
Targeting identical stimuli to different regions of the model evokes different contingents of membrane currents. Shown are stimulus-evoked voltage and current transients for 1 nS excitatory inputs to the soma vs the most-distal region of dendrite, D3D. A, Voltage deflections elicited by 1 nS excitatory synaptic input delivered to the soma at phases of 0.25, 0.5, or 0.75 (dashed or solid black lines, as indicated). Importantly, these stimuli yielded a type I somatic PRC. The unstimulated somatic voltage trajectory (gray line) covers approximately a 10 mV range between the depth of the AHP and spike threshold. As in Figure 4, spike advancements relative to control are evident, particularly for the late-phase stimulus. B, Voltage deflections elicited by 1 nS excitatory synaptic input to D3D at phases of 0.25, 0.5, or 0.75 (dashed or solid black lines, as indicated) are more than 10-fold larger than those elicited by equivalent somatic inputs, because D3D input resistance is much higher. Importantly, these stimuli yield a type II D3D PRC. Slight spike delays and advancements relative to control are again evident (*). C, Difference currents local to 1 nS somatic stimuli. The pattern of evoked currents differs depending on input phase, because the control somatic voltage trajectory is not flat. As in Figure 4, IDiff traces are curtailed at the time of the next spike. D, Difference currents local to 1 nS D3D stimuli. D3D stimuli yielded a peak IDiff-SK (green traces) that is five times greater than that elicited by identical somatic stimuli. Minimal differences are evident in the pattern of currents evoked by stimuli at difference phases, because the control voltage trajectory at D3D is flat. E, The synaptic current of the stimulus overwhelms membrane currents evoked at the soma. The sum of all somatic difference currents and difference leak are negligible relative to the synaptic current of a 1 nS AMPA input which is ∼70 pA. F, A 1 nS AMPA input to D3D yields a smaller synaptic current than the equivalent conductance input applied to the soma, because the D3D voltage deflection is much larger, reducing the synaptic driving force. The sum of all D3D difference currents, of which NaF and SK are the major contributors (D), is sufficiently large (and long-lasting) to rival the synaptic current.
Figure 6.
Figure 6.
Tandem local up- and downregulation of CaHVA and SK modulates the depth of the negative peak of distal dendritic PRCs. A, SK difference currents evoked by 2 nS excitatory synaptic input to D2D in models where the densities of CaHVA and SK have been dialed up or down in the compartments composing the D2D stimulus site. (Note that since the manipulation of conductance densities was limited to the 25 compartments of the D2D site, the spontaneous spiking behavior of the model was unaffected.) Traces are aligned such that stimulus onsets are at zero. B, D2D PRCs transition from type I to type II as CaHVA and SK are upregulated local to stimulus delivery. Visually identical type I PRCs result when either CaHVA or SK are eliminated from D2D (gray and dashed black lines). The negative region of D2D PRCs (asterisk) that remains when the CaHVA/SK mechanism had been locally disabled (by eliminating either CaHVA or SK) stems from compartments neighboring D2D where the mechanism was left intact and that also experience significant voltage deflection evoked by the stimulus. C, CaHVA difference currents evoked by 2 nS excitatory synaptic input to D3D in models where the densities of CaHVA and SK have been dialed up or down in the compartments composing the D3D stimulus site. Traces are aligned such that stimulus onsets are at zero. D, The negative region of D3D PRCs is deeper for models where CaHVA and SK has been upregulated local to stimulus delivery. Elimination of either CaHVA or SK from D3D yields visually identical type II PRCs, and like the D2D case, the remaining negative regions of these PRCs (asterisk) stems from compartments adjacent to the stimulated region where the CaHVA/SK mechanism remains intact.
Figure 7.
Figure 7.
Spike frequency affects somatic but not distal dendritic SK activation. A, Faster spiking elevates baseline levels and augments stimulus-evoked transients of somatic SK current. A1, When spiking was driven from 10 Hz (black trace) to 30 Hz (red trace) by increasing somatic applied current, the mean voltage at the soma (dashed black and red lines) was elevated ∼5 mV. A2, Driving faster spiking with somatic applied current elevated the baseline level of somatic SK current. Note that a 2 nS AMPA stimulus (red and black arrowheads) elicited immediate initiation of a spike when applied to the soma during 30 Hz spiking but not when applied during 10 Hz spiking. The stimulus applied during 30 Hz spiking evoked a larger peak in SK current (red asterisk) than is evoked by spontaneous spikes (red dashed traces). A3. During 10 Hz spiking, the somatic stimulus (black arrowhead) shortened the ISI during which it was delivered, but did not affect the subsequent ISI. A4. During 30 Hz spiking the somatic stimulus (red arrowhead) shortened the ISI during which it was delivered. However, the subsequent ISI was longer in duration, reflecting the larger SK current evoked by the stimulus during faster spiking. B, The time course of distal dendritic SK current flow is unaffected by spike frequency, spanning additional spike cycles during faster spiking. B1, During 10 Hz spiking, the local depolarization transient elicited by a 2 nS AMPA input to D3D (solid black line) was ∼55 mV relative to the control voltage trace (dashed black line). (Note that the ripples in the control voltage trace which demarcate the 100 ms spike cycles reflect attenuated spikes reaching the distal dendrite.) B2, During 30 Hz spiking, the local depolarization transient elicited by a 2 nS AMPA input to D3D (solid red line) was also ∼55 mV relative to the control voltage trace (dashed red line). B3, The peak and time course of the SK difference current (∼30 pA) evoked locally by AMPA inputs to D3D was not dependent on spike frequency. Difference current traces for 10 Hz (black) and 30 Hz (red) spiking overlay one another nearly perfectly.
Figure 8.
Figure 8.
Faster axosomatic spiking changes the shapes of somatic and dendritic PRCs, and it is necessary to consider stimulus effects that outlast a single spike cycle. A1, When the model is driven faster (from 10 Hz to 30 Hz) by increasing applied current to the soma, excitatory synaptic inputs of 2 nS yield somatic PRCs with larger, earlier peaks and less skewness. A2, Permanent PRCs are calculated by summing single cycle PRCs F1 through F5. At higher spike frequencies the peak of the permanent somatic PRC is reduced, occurs earlier in phase, and is less skewed. B1, Like the somatic case, during faster spiking the positive peak of distal dendritic (D3D) PRCs, occurs earlier in phase. The negative region present in F1 PRCs for D3D inputs delivered during slower spiking (green arrowhead) is pushed into F2 when spiking is driven faster (blue arrowhead). B2, Permanent PRCs for D3D inputs have only a slight positive peak for the slowest spike frequencies, and at 15 Hz or faster, the entire permanent PRC is negative. C1, Single-cycle PRCs for inputs to D2D show an amalgam of the effects of somatic or D3D stimulation. The red and blue arrowheads correspond to the red arrowhead in A1 and the blue arrowhead in B1. C2, The permanent PRCs for D2D inputs are type II for all spike frequencies up to 60 Hz, and they vary smoothly as a function of spike frequency. For high spike frequencies a negative region develops for stimuli late in phase.
Figure 9.
Figure 9.
Distal dendritic PRCs are robustly type II against significant variation of dendritic conductance densities. A, Single-cycle PRCs (A1, F1–F4) and the permanent PRC (A2) for models with 0, 1, and 4 times the base dendritic density of NaP. For models with greater dendritic densities of NaP the positive peak in the F1 PRC and both of the negative peaks in the F2 PRC were increased. B, Single-cycle PRCs (B1, F1–F4) and the permanent PRC (B2) for models with 0.5, 1, and 1.5 times the default dendritic density of the 4 spike conductances (NaF, NaP, KV3, and KV2). For models with greater dendritic densities of the spike conductances, the positive peak in the F1 PRC and both of the negative peaks in the F2 PRC were increased. C, Single-cycle PRCs (C1, F1–F4) and the permanent PRC (C2) for models with 0.5, 1, 1.5, and 2 times the base dendritic density of SK. For models with greater dendritic densities of SK, the positive peak in the F1 D2D PRC and the early-phase negative peak (blue arrowhead) is reduced, whereas the late-phase negative peak in the F2 D2D PRC (solid red arrowhead) is increased. Complete removal of SK conductance from the dendrite (red traces in C1 and C2) eliminates the late-phase negative peak in the F2 D2D PRC (red box arrowhead) and the corresponding permanent PRC is purely positive.

Similar articles

Cited by

References

    1. Abouzeid A, Ermentrout B. Type-II phase resetting curve is optimal for stochastic synchrony. Phys Rev E Stat Nonlin Soft Matter Phys. 2009;80 011911. - PubMed
    1. Achard P, De Schutter E. Complex parameter landscape for a complex neuron model. PLoS Comput Biol. 2006;2:e94. - PMC - PubMed
    1. Achuthan S, Canavier CC. Phase-resetting curves determine synchronization, phase locking, and clustering in networks of neural oscillators. J Neurosci. 2009;29:5218–5233. - PMC - PubMed
    1. Acker CD, Kopell N, White JA. Synchronization of strongly coupled excitatory neurons: relating network behavior to biophysics. J Comput Neurosci. 2003;15:71–90. - PubMed
    1. Baranauskas G, Tkatch T, Surmeier DJ. Delayed rectifier currents in rat globus pallidus neurons are attributable to Kv2.1 and Kv3.1/3.2 K+ channels. J Neurosci. 1999;19:6394–6404. - PMC - PubMed

Publication types

MeSH terms

Substances

LinkOut - more resources