. 2010 May;298(5):C1006-17.
doi: 10.1152/ajpcell.00359.2009. Epub 2010 Feb 17.

Influence of the extracellular matrix and integrins on volume-sensitive osmolyte anion channels in C2C12 myoblasts

Affiliations

Influence of the extracellular matrix and integrins on volume-sensitive osmolyte anion channels in C2C12 myoblasts

Iva Neveux et al. Am J Physiol Cell Physiol. 2010 May.

Abstract

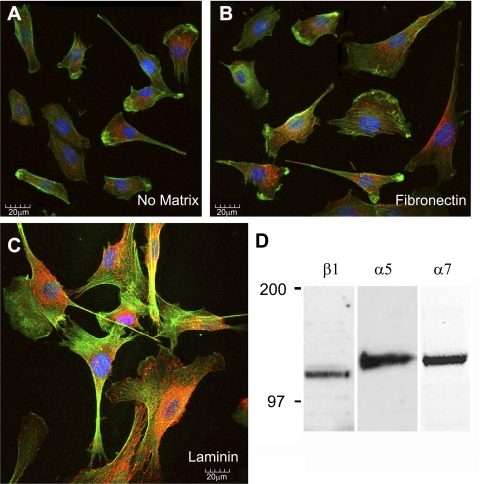
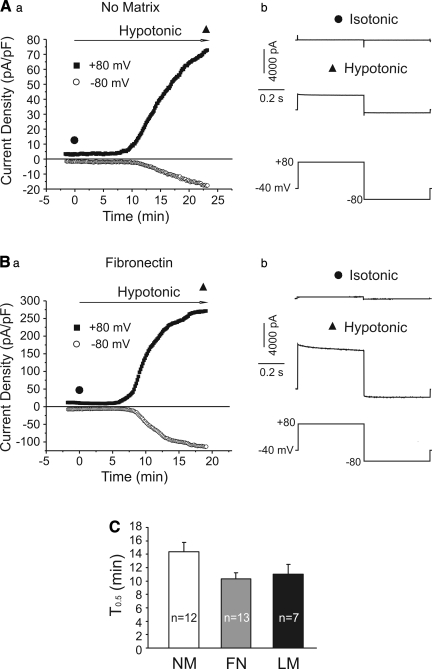
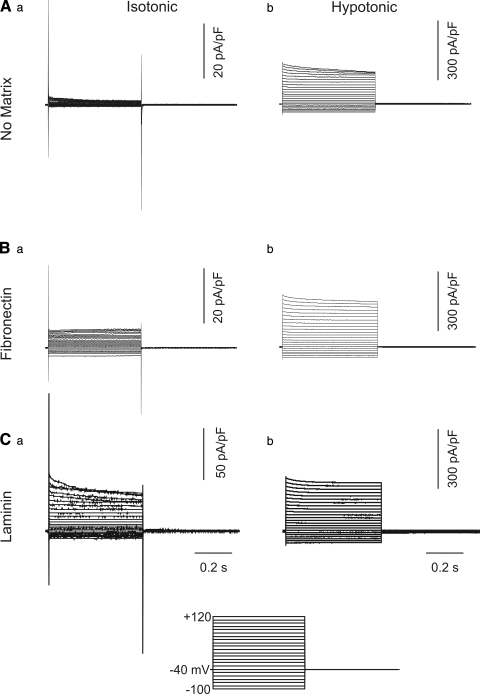
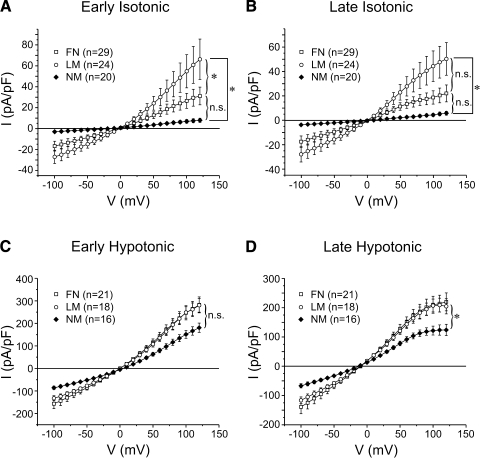
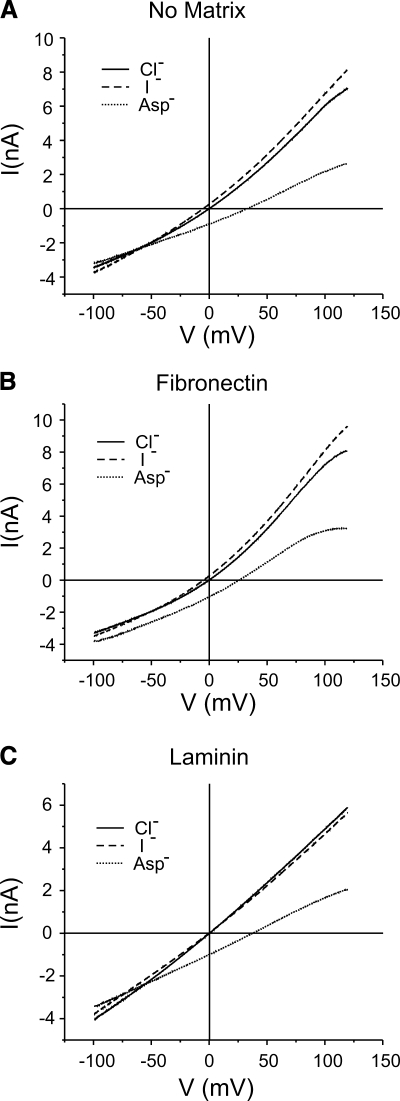
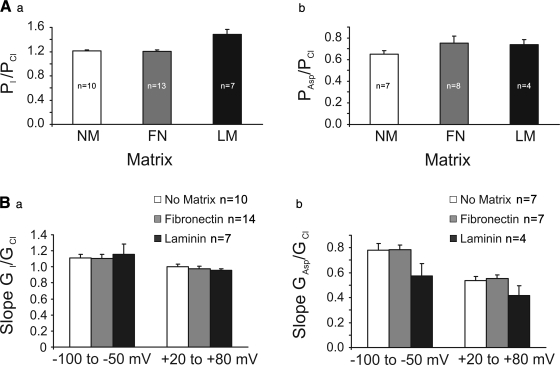
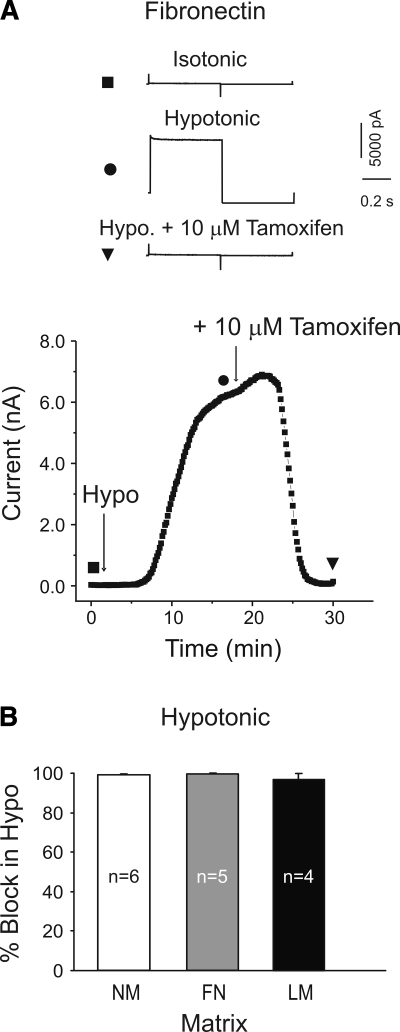
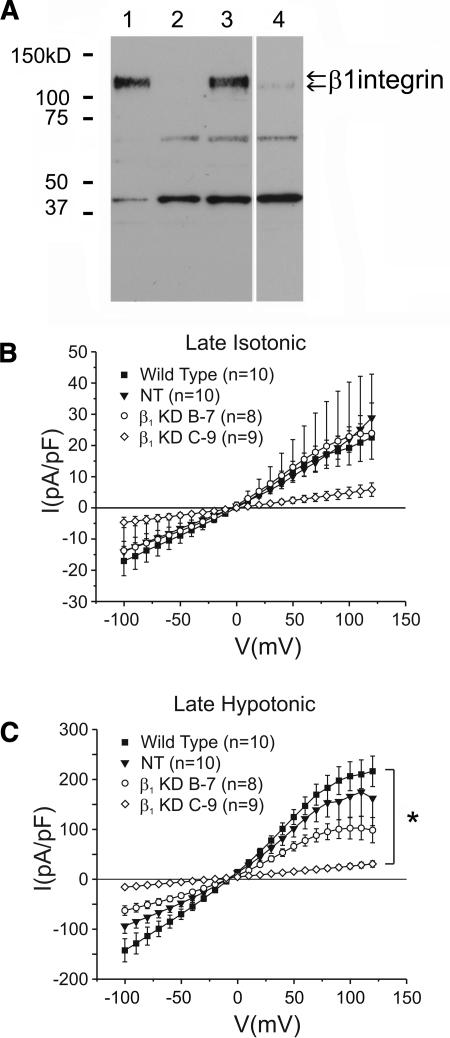
The purpose of this study was to determine whether extracellular matrix (ECM) composition through integrin receptors modulated the volume-sensitive osmolyte anion channels (VSOACs) in skeletal muscle-derived C2C12 cells. Cl(-) currents were recorded in whole cell voltage-clamped cells grown on laminin (LM), fibronectin (FN), or in the absence of a defined ECM (NM). Basal membrane currents recorded in isotonic media (300 mosmol/kg) were larger in cells grown on FN (3.8-fold at +100 mV) or LM (8.8-fold at +100 mV) when compared with NM. VSOAC currents activated by cell exposure to hypotonic solution were larger in cells grown on LM (1.72-fold at +100 mV) or FN (1.75-fold at +100 mV) compared with NM. Additionally, the kinetics of VSOAC activation was approximately 27% quicker on FN and LM. These currents were tamoxifen sensitive, displayed outward rectification, reversed at the equilibrium potential of Cl(-) and inactivated at potentials >+60 mV. Specific knockdown of beta(1)-integrin by short hairpin RNA interference strongly inhibited the VSOAC Cl(-) currents in cells plated on FN. In conclusion, ECM composition and integrins profoundly influence the biophysical properties and mechanisms of onset of VSOACs.


Figures

Fig. 1.
Fig. 1.
Immunofluorescent staining of C2C12 reveals that extracellular matrix (ECM) composition has a profound influence on myoblast phenotype. AC: C2C12 cells plated on uncoated coverslips (A), fibronectin (B), or laminin (C) were stained with antibody 9EG7 to identify β1-integrin-containing focal adhesions (red), FITC phalloidin to detect actin-containing stress fibers (green), and bis-benzamide to detect nuclei (blue). Note the profound differences in focal contact organization/distribution and the predominant increase in stress fiber formation in cells plated on laminin. All images were stained simultaneously and collected with identical settings. D: immunoblot illustrating the expression of β1-, α5-, and α7-integrins in C2C12 cells grown on standard tissue culture plates.
Fig. 2.
Fig. 2.
Alteration in the time course of changes in membrane currents elicited by switching from isotonic to hypotonic solutions in C2C12 cells plated on fibronectin or laminin. A and B: results representative of experiments carried out in a C2C12 cell cultured in the absence of matrix (A) and another one plated on fibronectin (B). For both A and B, a shows a plot of the time course of changes in membrane currents evoked by the voltage-clamp protocol displayed at bottom of b. As indicated, the holding potential was set to −40 mV. A repetitive double-pulse protocol consisting of an initial 500-ms step to +80 mV followed by a 500-ms repolarizing step to −80 mV was applied at a frequency of 0.1 Hz. The graphs in Aa and Ba plot current density measured at the end of each step to +80 (■) and −80 mV (○) as a function of time before and after exposure to hypotonic solution as indicated by the arrow above the plots. The filled circle and triangle in Ab and Bb indicate when the representative traces registered in isotonic and hypotonic solutions were recorded. Isotonic and hypotonic solutions were respectively set to 300 and 220 mosmol/kgH2O. C: bar graph summarizing the mean ± SE half-maximal time for activation of the volume-sensitive osmolyte anion channel (VSOAC) current (T0.5) after switching from isotonic to hypotonic solutions for cells grown in the absence of matrix (NM), fibronectin (FN), or laminin (LM). One-way ANOVA revealed significant differences between the means (P < 0.05); n, number of cells.
Fig. 3.
Fig. 3.
Typical families of membrane current recorded in isotonic and hypotonic conditions from C2C12 myoblasts grown in the absence or presence of ECM proteins. All families of membrane current were evoked by the protocol shown at bottom, which consisted of 500-ms steps ranging from −100 to +120 mV applied in 10-mV increments from a holding potential of −40 mV. AC: membrane currents recorded expressed as current density in pA/pF from cells plated on NM, FN, or LM, respectively. Within each panel (A, B, or C), isotonic (a) and hypotonic (b) traces were obtained in the same cell after a new steady state was detected. All traces shown are representative of mean ± SD data presented in Fig. 4.
Fig. 4.
Fig. 4.
Voltage dependence of membrane current recorded in isotonic and hypotonic conditions in C2C12 cells grown in the absence or presence of ECM proteins. A: mean current-voltage (I-V) relationships for the current measured at the beginning of steps ranging from −100 to +120 mV from a holding potential of −40 mV (see description of Fig. 2) in cells exposed to isotonic medium (early isotonic) and plated on NM, FN, or LM. B: the same as A except that the current was measured at the end of the 500-ms steps (late isotonic; see Fig. 2). C: the same as A except that the cells were exposed to hypotonic solution (early hypotonic). One-way ANOVA test revealed no significant differences between the means although the P value was just at the limit of significance (P = 0.0518). D: the same as B except that the cells were exposed to hypotonic solution (late hypotonic). Note the enhancement of membrane current in isotonic and hypotonic solutions for cells grown on FN or LM vs. NM. Also, irrespective of the presence or absence of matrix proteins, all currents recorded in isotonic and hypotonic media reversed near the predicted equilibrium potential for Cl (≈0 mV). n, number of cells; *one-way ANOVA where P < 0.05; NS, not significant.
Fig. 5.
Fig. 5.
Anion selectivity of hypotonic-induced membrane current recorded from C2C12 grown on NM, FN, or LM. AC: sample experiments from C2C12 cells plated respectively on NM, FN, or LM. For all traces, membrane current was elicited by 5-s voltage-ramp protocols ranging from −100 to +120 mV (44 mV/s) and imposed at a rate of 1 ramp every 10 s. In each panel, the three traces were obtained in the same cell after a sequential equimolar replacement of NaCl (solid line labeled Cl) with NaI (dotted line labeled I) and then with Na-aspartate (dashed line labeled Asp). Note the small but significant negative shift in reversal potential when external chloride is replaced with iodide, and the large positive shift in reversal potential when the solution is switched to the one containing Na-aspartate.
Fig. 6.
Fig. 6.
Selectivity and permeability profiles of hypotonic-induced VSOAC currents in C2C12 myoblasts grown on NM, FN, or LM. A: bar graphs reporting the mean calculated relative permeability of iodide to chloride (PI/PCl; a) and aspartate to chloride (PAsp/PCl; b) for VSOAC currents recorded in C2C12 cells plated on NM, FN, or LM. The shifts in reversal potential measured from anion replacement experiments identical to those shown in Fig. 5 were computed to determine PI/PCl and PAsp/PCl using the proper form of the Goldman-Hodgkin-Katz equation under bi-ionic conditions as described in materials and methods. There were no significant differences for PI/PCl and PAsp/PCl of the VSOAC current between the cells plated on the three different substrates; n, number of cells. B: the relative slope conductance over two ranges of membrane potential for iodide over chloride (GI/GCl) and aspartate over chloride (GAsp/GCl) of VSOAC currents was measured in cells plated with NM, FN, or LM and plotted in the bar graphs shown in a and b, respectively. There were no significant differences for GI/GCl and GAsp/GCl of the VSOAC current between the cells plated on the three different substrates. There were no significant differences noted between the means within each group of data; n, number of cells.
Fig. 7.
Fig. 7.
Tamoxifen sensitivity of the hypotonic-induced VSOAC current recorded in cells grown on NM, FN, or LM. A: representative traces and a graph showing the time course of VSOAC induction in C2C12 cells plated on FN after a switch to hypotonic solution and its suppression with 10 μM tamoxifen (identical voltage-clamp protocol to that described in Fig. 2). The timing of representative traces (shown above the graph) is labeled in the graph below with the symbol shown beside each trace. Measurements were made at the end of 500-ms steps to +80 mV (one step every 10 s) from a holding potential of −40 mV. B: bar graph reporting the mean % block by 10 μM tamoxifen of the VSOAC current at +80 mV in cells plated on NM, FN, or LM. No significant differences were found between the means. n, Number of cells.
Fig. 8.
Fig. 8.
Knockdown of β1-integrin with short hairpin RNA interference inhibited the basal and hypotonic-induced VSOAC current in cells plated on fibronectin. A: immunoblot analysis of β1-integrin expression (1/500 dilution of Ab1952, Millipore) in wild-type (WT) C2C12 cells (lane 1), two knockdown (KD) cell lines C-9 (lane 2) and B-7 (lane 4), and one nontarget cell line (lane 3). Note that lane 4 is a nonadjacent lane of the same blot. B: mean I-V relationships for the current measured at the end of steps ranging from −100 to +120 mV from a holding potential of −40 mV (see description of Fig. 4) in WT, nontarget (NT), β1-KD B-7, and β1-KD C-9 C2C12 (on FN), exposed to isotonic medium (late isotonic); n, number of cells. C: identical cells from B analyzed after exposure to hypotonic solution. *One-way ANOVA test revealed significant differences between the means with P < 0.05. Note the significant inhibition of both the basal anion and VSOAC currents in cell line C-9 in which 99% of β1-integrin protein was knocked down. n, Number of cells.

Similar articles

Cited by

References

    1. Arcangeli A, Becchetti A. Complex functional interaction between integrin receptors and ion channels. Trends Cell Biol 16: 631–639, 2006 - PubMed
    1. Askari JA, Buckley PA, Mould AP, Humphries MJ. Linking integrin conformation to function. J Cell Sci 122: 165–170, 2009 - PMC - PubMed
    1. Belkin AM, Retta SF, Pletjushkina OY, Balzac F, Silengo L, Fassler R, Koteliansky VE, Burridge K, Tarone G. Muscle beta1D integrin reinforces the cytoskeleton-matrix link: modulation of integrin adhesive function by alternative splicing. J Cell Biol 139: 1583–1595, 1997 - PMC - PubMed
    1. Belkin AM, Zhidkova NI, Balzac F, Altruda F, Tomatis D, Maier A, Tarone G, Koteliansky VE, Burridge K. Beta 1D integrin displaces the beta 1A isoform in striated muscles: localization at junctional structures and signaling potential in nonmuscle cells. J Cell Biol 132: 211–226, 1996 - PMC - PubMed
    1. Browe DM, Baumgarten CM. Angiotensin II (AT1) receptors and NADPH oxidase regulate Cl− current elicited by beta1 integrin stretch in rabbit ventricular myocytes. J Gen Physiol 124: 273–287, 2004 - PMC - PubMed

Publication types

MeSH terms

LinkOut - more resources