Supplementary eye field activity reflects a decision rule governing smooth pursuit but not the decision
- PMID: 20164387
- PMCID: PMC2867568
- DOI: 10.1152/jn.00215.2009
Supplementary eye field activity reflects a decision rule governing smooth pursuit but not the decision
Abstract
Animals depend on learned rules to guide their actions. Prefrontal (PFC) and premotor (PMC) cortex of primates have been reported to display rule-related neural activity, but it is unclear how signals encoded here are utilized to enforce the decision to act. The supplementary eye field (SEF) is a candidate for enforcing rule-guided ocular decisions because the activity of neurons here is correlated with the rule in an ocular decision-making task and because this area is anatomically more proximal to movement structures than PFC and PMC and receives inputs from them. However, in the previous work, the rule encoding and ocular outcome were confounded, leaving open the question of whether SEF activity is related to the rule or the behavior. In the present study, we attempted to discriminate between these alternatives by increasing task difficulty and forcing errors, thereby putting the stimulus and the behavior at odds. Single SEF neurons were recorded while monkeys performed the task in which the rule is to pursue a moving target if it intersects a visible square and maintain fixation if it does not. A delay period was imposed to monitor neural activity while the target approached the square. Two complementary populations of go and nogo neurons were found. When task difficulty was increased, the monkeys made more errors, and the neurons took longer to encode the rule. However, in error trials, most neurons continued to reflect the rule rather the monkey's ocular decision in both the delay period and after square intersection (movement period). This was the case for both directionally tuned and nondirectional SEF neurons. The results suggest that SEF neurons encode the ocular decision rule but that the decision itself likely occurs in a different structure that sums rule information from the SEF with information from other areas.
Figures

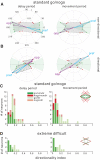
 , evoked saccade sites were located with 50–75 μA current. A: topographic map of recorded sites from monkey VC. The center of the map corresponds to the chamber center as indicated in the inset in the upright corner, which was centered 24 mm anterior and on the midline. Symbols are offset slightly if they were recorded from the same electrode track. Positive x and y axis values indicate anterior and right locations, and negative values indicate posterior and left. B: horizontal positions and measured depths of recording sites obtained from monkey VC. The coronal schematic of probed sites is based on a reference histological slice close to the center of the supplementary eye field (SEF) chamber.


Similar articles
-
Contrasting the roles of the supplementary and frontal eye fields in ocular decision making.J Neurophysiol. 2014 Jun 15;111(12):2644-55. doi: 10.1152/jn.00543.2013. Epub 2014 Mar 26. J Neurophysiol. 2014. PMID: 24671543 Free PMC article.
-
Neuronal Correlates of Serial Decision-Making in the Supplementary Eye Field.J Neurosci. 2018 Aug 15;38(33):7280-7292. doi: 10.1523/JNEUROSCI.3643-17.2018. Epub 2018 Jul 16. J Neurosci. 2018. PMID: 30012690 Free PMC article.
-
Neuronal activity in the caudal frontal eye fields of monkeys during memory-based smooth pursuit eye movements: comparison with the supplementary eye fields.Cereb Cortex. 2011 Aug;21(8):1910-24. doi: 10.1093/cercor/bhq261. Epub 2011 Jan 5. Cereb Cortex. 2011. PMID: 21209120 Free PMC article.
-
The role of supplementary eye field in goal-directed behavior.J Physiol Paris. 2015 Feb-Jun;109(1-3):118-28. doi: 10.1016/j.jphysparis.2015.02.002. Epub 2015 Feb 23. J Physiol Paris. 2015. PMID: 25720602 Free PMC article. Review.
-
Representation of object-centered space in the primate frontal lobe.Brain Res Cogn Brain Res. 1996 Dec;5(1-2):147-56. doi: 10.1016/s0926-6410(96)00051-1. Brain Res Cogn Brain Res. 1996. PMID: 9049081 Review.
Cited by
-
Eye movements as a readout of sensorimotor decision processes.J Neurophysiol. 2020 Apr 1;123(4):1439-1447. doi: 10.1152/jn.00622.2019. Epub 2020 Mar 11. J Neurophysiol. 2020. PMID: 32159423 Free PMC article.
-
Smooth pursuit preparation modulates neuronal responses in visual areas MT and MST.J Neurophysiol. 2015 Jul;114(1):638-49. doi: 10.1152/jn.00636.2014. Epub 2015 May 27. J Neurophysiol. 2015. PMID: 26019315 Free PMC article.
-
Supplementary eye field during visual search: salience, cognitive control, and performance monitoring.J Neurosci. 2012 Jul 25;32(30):10273-85. doi: 10.1523/JNEUROSCI.6386-11.2012. J Neurosci. 2012. PMID: 22836261 Free PMC article.
-
Eye movements and imitation learning: intentional disruption of expectation.J Vis. 2011 Jan 6;11(1):7. doi: 10.1167/11.1.7. J Vis. 2011. PMID: 21212191 Free PMC article.
-
Anticipatory smooth eye movements with random-dot kinematograms.J Vis. 2012 Oct 1;12(11):1. doi: 10.1167/12.11.1. J Vis. 2012. PMID: 23027686 Free PMC article.
References
-
- Amador N, Schlag-Rey M, Schlag J. Primate antisaccade. II. Supplementary eye field neuronal activity predicts correct performance. J Neurophysiol 91: 1672–1689, 2004. - PubMed
-
- Barbas H, Pandya DN. Architecture and frontal cortical connections of the premotor cortex (area 6) in the rhesus monkey. J Comp Neurol 256: 211–228, 1987. - PubMed
-
- Barbas H, Pandya DN. Architecture and intrinsic connections of the prefrontal cortex in the rhesus monkey. J Comp Neurol 286: 353–375, 1989. - PubMed
-
- Britten KH, Newsome WT, Shadlen MN, Celebrini S, Movshon JA. A relationship between behavioral choice and the visual responses of neurons in macaque MT. Vis Neurosci 13: 87–100, 1996. - PubMed
Publication types
MeSH terms
Grants and funding
LinkOut - more resources
Full Text Sources
Miscellaneous

