. 2010 Apr;103(4):2158-73.
doi: 10.1152/jn.91361.2008. Epub 2010 Feb 17.

Head-free gaze shifts provide further insights into the role of the medial cerebellum in the control of primate saccadic eye movements

Affiliations

Head-free gaze shifts provide further insights into the role of the medial cerebellum in the control of primate saccadic eye movements

Albert F Fuchs et al. J Neurophysiol. 2010 Apr.

Abstract

This study examines how signals generated in the oculomotor cerebellum could be involved in the control of gaze shifts, which rapidly redirect the eyes from one object to another. Neurons in the caudal fastigial nucleus (cFN), the output of the oculomotor cerebellum, discharged when monkeys made horizontal head-unrestrained gaze shifts, composed of an eye saccade and a head movement. Eighty-seven percent of our neurons discharged a burst of spikes for both ipsiversive and contraversive gaze shifts. In both directions, burst end was much better timed with gaze end than was burst start with gaze start, was well correlated with eye end, and was poorly correlated with head end or the time of peak head velocity. Moreover, bursts accompanied all head-unrestrained gaze shifts whether the head moved or not. Therefore we conclude that the cFN is not part of the pathway that controls head movement. For contraversive gaze shifts, the early part of the burst was correlated with gaze acceleration. Thereafter, the burst of the neuronal population continued throughout the prolonged deceleration of large gaze shifts. For a majority of neurons, gaze duration was correlated with burst duration; for some, gaze amplitude was less well correlated with the number of spikes. Therefore we suggest that the population burst provides an acceleration boost for high acceleration (smaller) contraversive gaze shifts and helps maintain the drive required to extend the deceleration of large contraversive gaze shifts. In contrast, the ipsiversive population burst, which is less well correlated with gaze metrics but whose peak rate occurs before gaze end, seems responsible primarily for terminating the gaze shift.


Figures
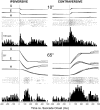
Fig. 1.
Fig. 1.
Discharge pattern of an exemplar caudal fastigial nucleus (cFN) neuron (S12-1) during small (10°) and large (65°) horizontal head-free gaze shifts. For both amplitudes, we show 8 or 9 very similar ipsiversive and contraversive gaze shifts in the left and right columns, respectively. In all 4 examples, traces from top to bottom are the horizontal components of gaze, eye, and head movement, the associated discharge patterns shown as rasters and an average histogram (bin width = 8 ms). The amplitude calibration bar applies to all movements. All traces aligned on the start of the gaze shift (thin vertical lines).
Fig. 2.
Fig. 2.
Burst pattern of an exemplar cFN neuron (W53-1) for head-free horizontal gaze shifts ranging from 10 to 100°. Ipsiversive gaze shifts appear in the left 2 columns and contraversive gaze shifts in the right 2 columns. For each column, the rasters associated with either 326 ipsi- or 327 contraversive gaze shifts are aligned (see thin vertical lines) either on gaze start (1st and 3rd columns) or gaze end (2nd and 4th columns). The rasters are organized from bottom to top in order of increasing gaze duration. All gaze shifts above the horizontal double-headed arrows have total head movement components of ≥5°.
Fig. 3.
Fig. 3.
Burst pattern of another cFN neuron (W59-6) for head-free horizontal gaze shifts ranging from ∼2 to 80°. There are 177 and 150 ipsi- and contraversive gaze shifts, respectively. Presentation and traces as in Fig. 2.
Fig. 4.
Fig. 4.
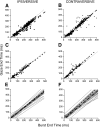
Correlation of the timing of the end of the burst with the end of the gaze shift re gaze onset. A–D: linear regressions of gaze end time with burst end time for ipsi- and contraversive gaze shifts, left and right columns, respectively, for the exemplar neurons in Figs. 2 (A and B) and 3 (C and D). The equations for the linear regressions in AD: gaze end time (GET) = 0.9 × burst end time (BET) − 5.43 (r = 0.95), GET = 1.01 × BET − 18.75 (r = 0.95), GET = 0.94 × BET + 2.84 (r = 0.97), and GET = 1.08 × BET + 2.42 (r = 0.96), respectively. Thin lines in A–D have a unity slope. E and F: gaze end time vs. burst end time linear fits for all 33 burst neurons; fits for the units in Figs. 2 and 3 are shown as long and short dashed lines, respectively.
Fig. 5.
Fig. 5.
Relation of gaze duration with burst duration. A–D: gaze duration as a function of burst duration for ipsi- and contraversive gaze shifts, left and right columns, respectively, for the exemplar neurons in Figs. 3 (A and B) and 2 (C and D). Data are divided into those obtained when head movements were ≤5° (gray data points; only those within ±3 SD of the mean were considered) and those that were not (open circles). Linear regressions for the small and large head movement data are shown as solid black and dashed lines, respectively. Linear regressions—A: gaze duration (GD) = 1.04 × burst duration (BD) − 2.71 (r2 = 0.88); B: GD = 1.10 × BD − 12.69 (r2 = 0.86); C: small head movements: GD = 0.56 × BD + 15.04 (r2 = 0.53); large head movements: GD = 0.96 × BD + 63.59 (r2 = 0.40); and D: small head movements: GD = 0.38 × BD + 21.39 (r2 = 0.31); large head movements: GD = 1.1 × BD + 13.05 (r2 = 0.56).
Fig. 6.
Fig. 6.
Comparison of discharge patterns of 2 exemplar neurons during large ipsi- and contraversive gaze shifts matched for peak gaze velocity. For both neurons (W39-2: A–C and S9-1: D–F), traces from top to bottom are unit rasters from individual trials associated with contraversive (red) and ipsiversive (blue) gaze shifts, time courses of the associated absolute gaze velocities of the individual trials, and spike density functions (20 ms Gaussian) of unit activity. In C and F, thick red and blue lines show the averages for all contra- and ipsiversive trials, respectively. The lowest traces (Contra-Ipsiversive) are the difference between the averages of the contra- and ipsiversive gaze shifts for each neuron. All traces are aligned on the start of the gaze shift (t = 0, dashed lines). Gaze amplitude ranged from 70 to 85 and 60 to 73° for W39-2 and S9-1, respectively.
Fig. 7.
Fig. 7.
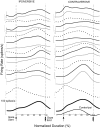
Comparison of average spike density functions for 15 neurons with sufficient data. Spike density functions for ipsi- and contraversive gaze shifts, left and right columns, respectively, have been adjusted so that the associated gaze shifts have equal average 100 ms durations. Single and double tipped arrows indicate the beginning and end, respectively, of the duration-normalized gaze shift. All traces are aligned on the start of the gaze shift (t = 0). Paired side-by-side traces with lines of the same quality (black, gray, and dashed) in the 2 columns refer to the same unit. The thick curves at the bottom of each column are the ipsi- and contraversive population averages across all 15 neurons; at the bottom of the right column, the thin curve labeled Contra-Ipsi shows their difference. The 1st and 3rd units from the top are those described in detail in the left and right columns, respectively, of Fig. 6. All brackets represent 100 spikes/s; the bottom of the bracket indicates the unit's 0 firing rate. The units shown in Figs. 1–3 and 6 (S9-1 and W39-2) are the 9th, 12th, 2nd, 3rd, and 1st pairs of traces, respectively.
Fig. 8.
Fig. 8.
Comparison of discharge patterns associated with small and large contraversive head-free gaze shifts for the exemplar neurons in Fig. 6. A and B: data from the unit shown in Fig. 6, D–F. C and D: data from the unit shown in Fig. 6, A–C. In A and C, traces from top to bottom are contraversive horizontal gaze position, velocity, and acceleration; the associated spike rasters and average response histograms are for the smaller gaze shifts only. All traces aligned on gaze position start time. The blue traces are position, velocity, and acceleration traces are for the smaller gaze shifts; the red traces are the position, velocity, and acceleration profiles of the larger shifts that are shown in B and D with their associated spike rasters and average response histograms. For each unit, trials for each gaze amplitude were selected to have similar peak velocities. Vertical dashed lines indicate gaze start time. Histogram bin widths are 8 ms.

Similar articles

Cited by

References

    1. Barash S, Melikyan A, Sivakov A, Zhang M, Glickstein M, Thier P. Saccadic dysmetria and adaptation after lesions of the cerebellar cortex. J Neurosci 19: 10931–10939, 1999 - PMC - PubMed
    1. Batton R, Jayaraman A, Ruggiero D, Carpenter M. Fastigial efferent projections in the monkey: an autoradiographic study. J Comp Neurol 174: 281–306, 1977 - PubMed
    1. Becker W. Metrics. In: The Neurobiology of Saccadic Eye Movements, edited by Wurtz B, Goldberg M. Amsterdam: Elsevier, 1989, p. 13–67 - PubMed
    1. Brettler S, Fuchs A. Activity of caudal fastigial nucleus neurons during head-unrestrained gaze shifts in rhesus monkeys. Soc Neurosci Abstr 27: 405.11, 2001
    1. Brettler S, Fuchs A, Ling L. Discharge patterns of cerebellar output neurons in the caudal fastigial nucleus during head-free gaze shifts in primates. Ann NY Acad Sci 1004: 61–68, 2003 - PubMed

Publication types