Comparative Study
. 2010 May;103(5):2544-56.
doi: 10.1152/jn.01017.2009. Epub 2010 Feb 17.

Mapping human somatosensory cortex in individual subjects with 7T functional MRI

Affiliations
Comparative Study

Mapping human somatosensory cortex in individual subjects with 7T functional MRI

R M Sanchez-Panchuelo et al. J Neurophysiol. 2010 May.

Abstract

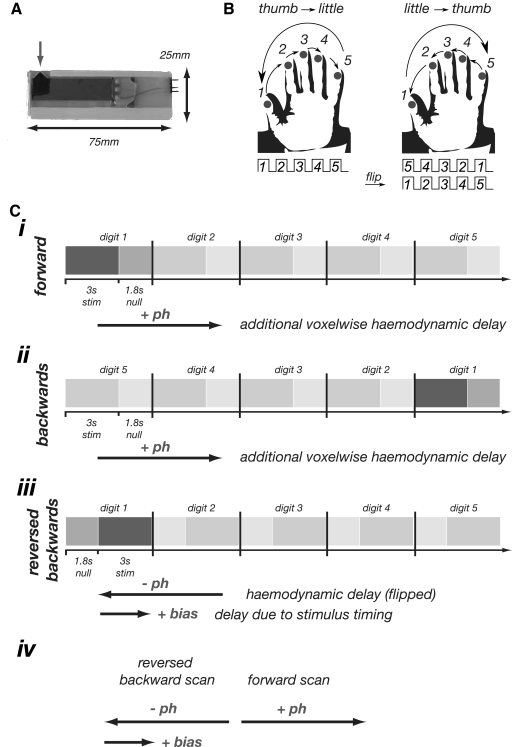
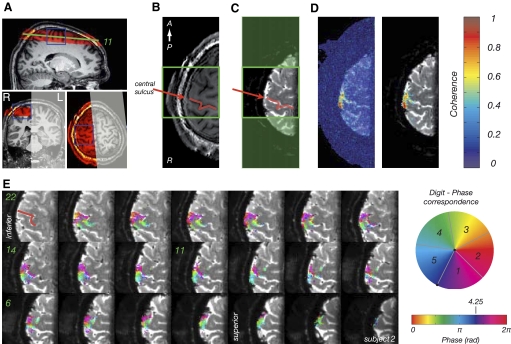
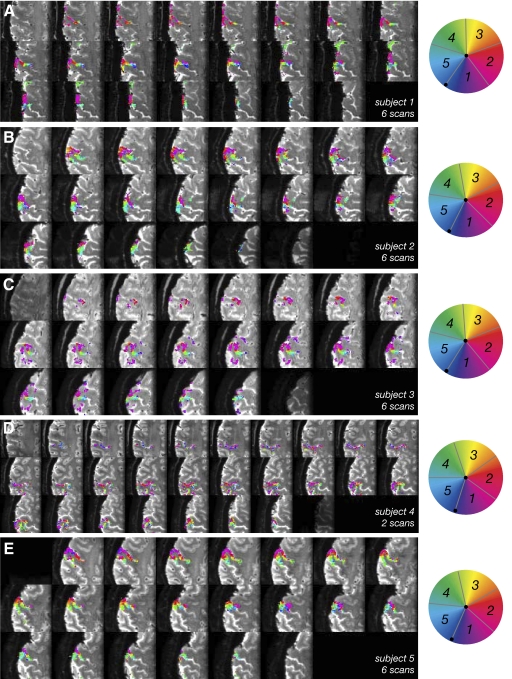
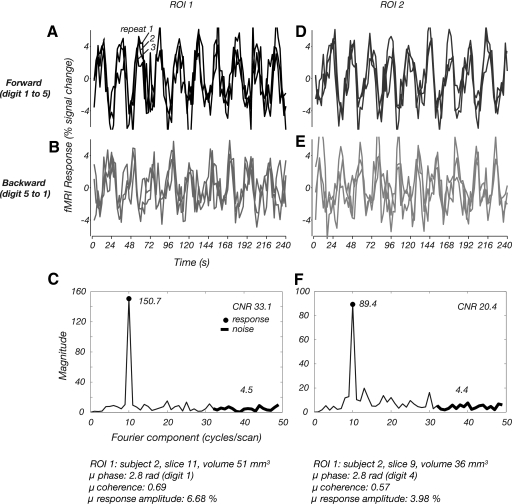
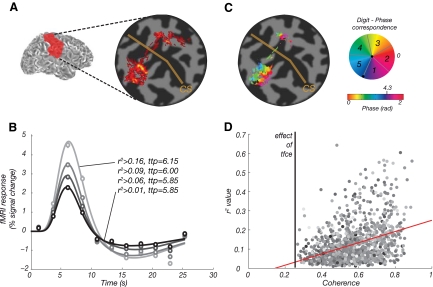
Functional magnetic resonance imaging (fMRI) is now routinely used to map the topographic organization of human visual cortex. Mapping the detailed topography of somatosensory cortex, however, has proven to be more difficult. Here we used the increased blood-oxygen-level-dependent contrast-to-noise ratio at ultra-high field (7 Tesla) to measure the topographic representation of the digits in human somatosensory cortex at 1 mm isotropic resolution in individual subjects. A "traveling wave" paradigm was used to locate regions of cortex responding to periodic tactile stimulation of each distal phalangeal digit. Tactile stimulation was applied sequentially to each digit of the left hand from thumb to little finger (and in the reverse order). In all subjects, we found an orderly map of the digits on the posterior bank of the central sulcus (postcentral gyrus). Additionally, we measured event-related responses to brief stimuli for comparison with the topographic mapping data and related the fMRI responses to anatomical images obtained with an inversion-recovery sequence. Our results have important implications for the study of human somatosensory cortex and underscore the practical utility of ultra-high field functional imaging with 1 mm isotropic resolution for neuroscience experiments. First, topographic mapping of somatosensory cortex can be achieved in 20 min, allowing time for further experiments in the same session. Second, the maps are of sufficiently high resolution to resolve the representations of all five digits and third, the measurements are robust and can be made in an individual subject. These combined advantages will allow somatotopic fMRI to be used to measure the representation of digits in patients undergoing rehabilitation or plastic changes after peripheral nerve damage as well as tracking changes in normal subjects undergoing perceptual learning.


Figures

Fig. 1.
Fig. 1.
A: single piezo-electric stimulator device. The gray arrow indicates the protruding tip which is applied to skin (∼1 mm thickness); direction of movement is in and out of the plane. B: illustration of the traveling wave paradigm. Vibrotactile stimuli were applied to the fingertips in “forward” ordering from thumb to little finger or “backward” ordering from little finger to thumb. The backward scans can be time reversed and time-shifted to cancel any residual hemodynamic lag. C: illustration of expected temporal delays in functional magnetic resonance imaging (fMRI) responses in traveling wave paradigm due to the effect of hemodynamics and experimental design. I: timing diagram for the forward sequence. For voxels responding to stimulation of digit 1, the only delay (w.r.t. the onset of cycle) is due to hemodynamics (+ph). The additional arrow indicates this delay. Ii: timing diagram for the backward sequence, again with additional arrow indicating the delay (+ph). Iii: time-reversal of the backward sequence leading to reversal of the inherent hemodynamic delay. The asymmetry in the stimulation paradigm (3 s stimulation is followed by an 1.8 s off period) results in the sequence being delayed (or biased) by 1.8 s. iv: summary of the effects of hemodynamic delay and bias due to the stimulation paradigm. If the time series are simply averaged, the resulting time course will retain a delay (of magnitude +bias/2). To remedy this, we advance the phase values of the time-reversed backward scan by 1.8 s giving the difference between the 2 phase values for a given region of interest (ROI) equal to twice the inherent hemodynamic delay.
Fig. 2.
Fig. 2.
Effect of shimming on geometric distortion in echo planar imaging (EPI) images with pixel bandwidth of 22.8 Hz and phase-encoding (and hence distortion) in the right-left direction. A: skull-stripped anatomical image (MPRAGE, 1 mm isotropic resolution). Highlighted square indicates shimming volume. Orientation of stack as shown in Fig. 3A. B: EPI acquired with FASTMAP shimming method. C: EPI from B (hot colors) superimposed on undistorted MPRAGE image (greyscale) from A. Note the significant mismatch between echo-planar and MPRAGE images. D: field map obtained with the FASTMAP shimming method. Colors indicate the magnitude of geometric distortion in the phase-encode direction (right-left) in mm. The black square represents the border of the shim box. E: histogram of the geometric distortion, proportion of voxels in shim box (y axis) with given spatial offset (in mm, x axis). F–I as in B–E for data acquired using the image-based shimming method. Note the reduced distortions in the field map (H) with the histogram (I) centered close to 0 and narrowed for the image based shimming method.
Fig. 3.
Fig. 3.
A: location of the imaging stack for zoomed fMRI (red) superimposed on MPRAGE scan for a representative subject. The gray shaded area indicates the location of the outer volume suppression slab and the blue lines show the location of the shim box. B: single slice of the MPRAGE image (1 mm isotropic MPRAGE) collected in the same location as the T2*-weighted EPI data. The red line indicates the location of central sulcus, the green box the cropping used in E. C: mean T2* weighted EP image obtained by averaging 100 repeats of 1 functional MRI scan; because fMRI data contain slight residual geometric distortions with respect to the MPRAGE images, statistical images are superimposed on the average EPI data. Red line, as in B. D: statistical map superimposed on mean EPI image. Transparent colors, coherence with best-fitting sinusoid at frequency of stimulus paradigm. Note values close to 1, indicating high statistical significance. Left: no thresholding applied. Right: statistical image obtained with threshold-free cluster enhancement, TFCE. E: statistical map (from the average of 6 scans) superimposed on mean T2*-weighted EPI data for all slices in stack. Axial slices are numbered from most superior (1) to most inferior (22). Colors indicate the phase values from traveling wave paradigm. Note that the statistical map is thresholded based on application of TFCE to the coherence map (see D). For this subject, the ROI contained 1,998 voxels. The mean coherence value was 0.53 ± 0.13 (minimum-to-maximum range: 0.35–0.94), the mean fMRI response amplitude across all voxels 3.28 ± 3.2% (range: 0.72–21.38), and the mean raw image intensity of the EP image was 22,434 ± 6,957 (range: 4,014–50,071).
Fig. 4.
Fig. 4.
Statistical maps (average of 6 scans except for subject 4 with 2 scans) for each of 5 subjects scanned, superimposed on mean T2*-weighted EPI data for all slices in the stack, equivalent to Fig. 3E. Axial slices are numbered from most superior (1) to most inferior (22). Colors indicate the phase values from traveling wave paradigm. Statistical maps are thresholded using TFCE.
Fig. 5.
Fig. 5.
Time course plots from 2 small ROIs (columns) for 2 different stimulus conditions (rows). Details of the ROI are provided at the bottom of the figure. A: each trace, mean fMRI response in ROI1 for each of 3 scans with a forward stimulus (advancing from digits 1–5). B: fMRI responses in ROI1 for backward sequence. C: amplitude spectrum of average time course across all scans in ROI1. Black circle, magnitude at stimulus alternation frequency. Thick black line, high-frequency components used to calculate contrast-to-noise ratio (CNR). D–F: corresponding data for ROI2.
Fig. 6.
Fig. 6.
A: coherence map based on the r2 values from the event-related data (subject 5). B: mean event-related fMRI responses in S1 for subject 5. Symbols, mean event-related time course for voxels in the functional ROI defined in the traveling wave experiment (error bars, SE, are smaller than the plot symbols). Colors, data were thresholded according to the distribution of r2 value obtained for each voxel in the event-related analysis [ROI contain voxels with r2 over 0, 25, 50, and 75% of the r2 distribution (as for Table 3 for all subjects)], results plotted separately for the lowest (dark) to highest (bright) threshold. Solid lines, corresponding fits to the hemodynamic response function. ttp indicates the hemodynamic delay of the curve. C: coherence map from the traveling wave analysis (subject 5). Similar activation patterns can be seen for the primary somatosensory cortex for the event-related paradigm (A). D: direct comparison of the traveling wave and event-related data for subject 5 indicates that voxels with the highest r2 values (obtained in the event-related experiment) also tend to give most significant responses in the traveling wave experiment (linear regression: y = 0.29x − 0.04, Pearson correlation:0.39). Color, image intensity of underlying T2*-weighted EPI data.
Fig. 7.
Fig. 7.
A: the stimulus input function of the forward scan of digit 1 (black line) convolved with the double gamma variate hemodynamic response function [HRF; 6 s time-to-peak (TTP); Eq. 1, a1 = 6, a2 = 12, b1 = 0.9 s, b2 = 0.9 s, c = 0.35] to simulate the forward fMRI response (thick black line). The simulated waveform (blue line) is then fitted to a sinusoidal wave of period 24 s (light gray line). The sinusoidal waveform shows a reduced time-to-peak compared with the model response. B: the stimulus input function of the backward scan for digit 1 (dark gray line), and the convolution with the double gamma variate HRF with 6 s TTP (as shown in A) to simulate the backward fMRI time course (thick black line). C: time reversed backward scan for digit 1 (thick black line) and fitted sinusoidal waveform (light gray line). The sinusoidal waveform shows a delayed time to peak compared with the double gamma variate HRF. The hemodynamic delay from the traveling wave analysis is estimated by first calculating the time between peaks of the 2 fitted sinusoid waveforms (light gray lines) in A and C. A delay of 1.8 s is then added to account for the time between stimulation of each digit (as shown in Fig. 1C). The resulting time difference is then divided by 2 to give an estimate of the hemodynamic delay. D: simulated double gamma variate HRF with a1 = 3 – 9 to simulate the range of hemodynamic delays found in the brain. E: simulated TTP of hemodynamic delay as determined from the traveling wave analysis [from the phase difference in the sinusoidal fits (A) and (C)] vs. the true hemodynamic TTP from the simulated HRF (D). Data show a parabolic relationship of y = 0.03x2 + 0.70x − 0.51.

Similar articles

Cited by

References

    1. Boynton GM, Engel SA, Glover GH, Heeger DJ. Linear systems analysis of functional magnetic resonance imaging in human V1. J Neurosci 16: 4207–4221, 1996. - PMC - PubMed
    1. Buckner RL, Goodman J, Burock M, Rotte M, Koutstaal W, Schacter D, Rosen B, Dale AM. Functional-anatomic correlates of object priming in humans revealed by rapid presentation event-related fMRI. Neuron 20: 285–296, 1998. - PubMed
    1. Burock MA, Buckner RL, Woldorff MG, Rosen BR, Dale AM. Randomized event-related experimental designs allow for extremely rapid presentation rates using functional MRI. Neuroreport 9: 3735–3739, 1998. - PubMed
    1. Butterworth S, Francis S, Kelly E, McGlone F, Bowtell R, Sawle GV. Abnormal cortical sensory activation in dystonia: an fMRI study. Mov Disord 18: 673–682, 2003. - PubMed
    1. Darian-Smith I. Touch in primates. Annu Rev Psychol 33: 155–194, 1982. - PubMed

Publication types