

Augmented sodium currents contribute to the enhanced excitability of small diameter capsaicin-sensitive sensory neurons isolated from Nf1+/⁻ mice
- PMID: 20164394
- PMCID: PMC2853284
- DOI: 10.1152/jn.01010.2009
Augmented sodium currents contribute to the enhanced excitability of small diameter capsaicin-sensitive sensory neurons isolated from Nf1+/⁻ mice
Abstract
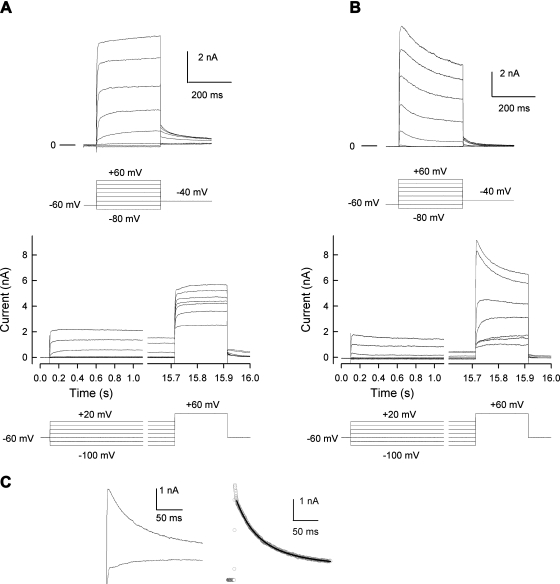
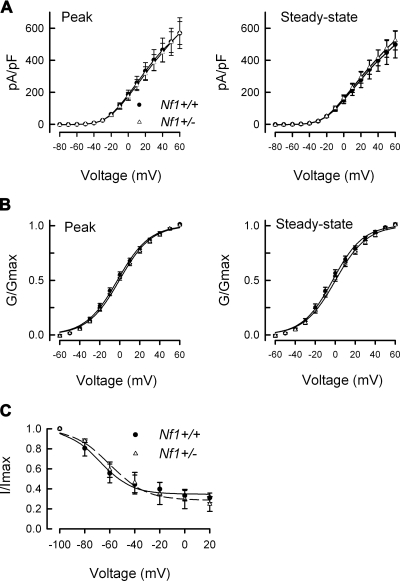
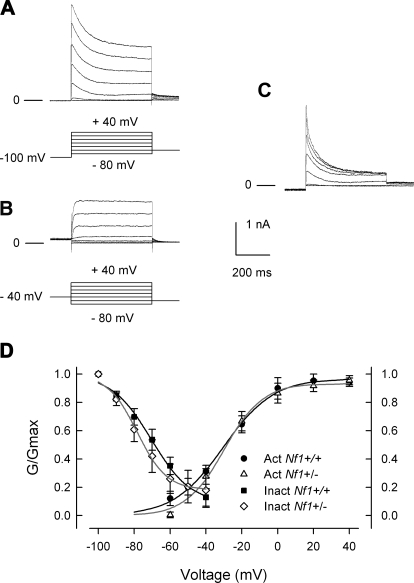
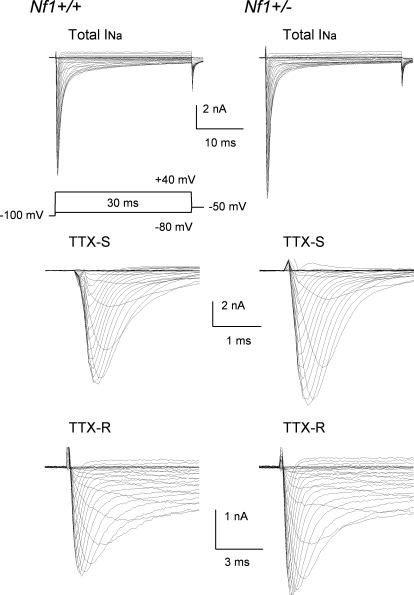
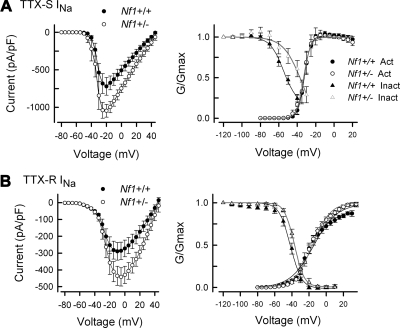
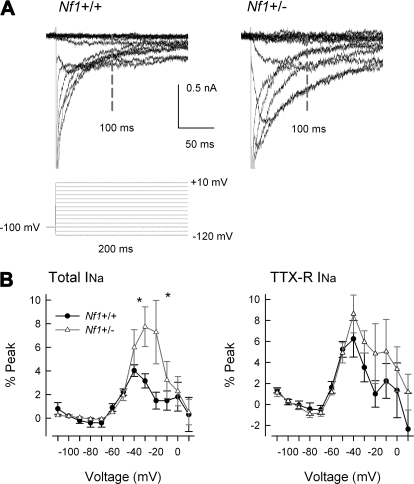
Neurofibromin, the product of the Nf1 gene, is a guanosine triphosphatase activating protein (GAP) for p21ras (Ras) that accelerates conversion of active Ras-GTP to inactive Ras-GDP. Sensory neurons with reduced levels of neurofibromin likely have augmented Ras-GTP activity. We reported previously that sensory neurons isolated from a mouse model with a heterozygous mutation of the Nf1 gene (Nf1+/⁻) exhibited greater excitability compared with wild-type mice. To determine the mechanism giving rise to the augmented excitability, differences in specific membrane currents were examined. Consistent with the enhanced excitability of Nf1+/⁻ neurons, peak current densities of both tetrodotoxin-resistant sodium current (TTX-R I(Na)) and TTX-sensitive (TTX-S) I(Na) were significantly larger in Nf1+/⁻ than in wild-type neurons. Although the voltages for half-maximal activation (V(0.5)) were not different, there was a significant depolarizing shift in the V(0.5) for steady-state inactivation of both TTX-R and TTX-S I(Na) in Nf1+/⁻ neurons. In addition, levels of persistent I(Na) were significantly larger in Nf1+/⁻ neurons. Neither delayed rectifier nor A-type potassium currents were altered in Nf1+/⁻ neurons. These results demonstrate that enhanced production of action potentials in Nf1+/⁻ neurons results, in part, from larger current densities and a depolarized voltage dependence of steady-state inactivation for I(Na) that potentially leads to a greater availability of sodium channels at voltages near the firing threshold for the action potential.
Figures
Similar articles
-
N-type calcium current, Cav2.2, is enhanced in small-diameter sensory neurons isolated from Nf1+/- mice.Neuroscience. 2014 Jun 13;270:192-202. doi: 10.1016/j.neuroscience.2014.04.021. Epub 2014 Apr 19. Neuroscience. 2014. PMID: 24755485 Free PMC article.
-
Neurofibromatosis: the role of guanosine triphosphatase activating proteins in sensory neuron function.Sheng Li Xue Bao. 2008 Oct 25;60(5):581-3. Sheng Li Xue Bao. 2008. PMID: 18958364
-
Ras signaling pathways mediate NGF-induced enhancement of excitability of small-diameter capsaicin-sensitive sensory neurons from wildtype but not Nf1+/- mice.Neurosci Lett. 2011 Jun 1;496(2):70-4. doi: 10.1016/j.neulet.2011.03.083. Epub 2011 Apr 8. Neurosci Lett. 2011. PMID: 21501659 Free PMC article.
-
Sensory neurons from Nf1 haploinsufficient mice exhibit increased excitability.J Neurophysiol. 2005 Dec;94(6):3670-6. doi: 10.1152/jn.00489.2005. Epub 2005 Aug 10. J Neurophysiol. 2005. PMID: 16093333
-
Stimulus-evoked release of neuropeptides is enhanced in sensory neurons from mice with a heterozygous mutation of the Nf1 gene.Neuroscience. 2006;137(2):637-45. doi: 10.1016/j.neuroscience.2005.09.030. Epub 2005 Nov 17. Neuroscience. 2006. PMID: 16298082
Cited by
-
CRISPR/Cas9 editing of Nf1 gene identifies CRMP2 as a therapeutic target in neurofibromatosis type 1-related pain that is reversed by (S)-Lacosamide.Pain. 2017 Dec;158(12):2301-2319. doi: 10.1097/j.pain.0000000000001002. Pain. 2017. PMID: 28809766 Free PMC article.
-
A porcine model of neurofibromatosis type 1 that mimics the human disease.JCI Insight. 2018 Jun 21;3(12):e120402. doi: 10.1172/jci.insight.120402. eCollection 2018 Jun 21. JCI Insight. 2018. PMID: 29925695 Free PMC article.
-
Reduced expression of SynGAP, a neuronal GTPase-activating protein, enhances capsaicin-induced peripheral sensitization.J Neurophysiol. 2011 Jul;106(1):309-18. doi: 10.1152/jn.00963.2010. Epub 2011 Apr 27. J Neurophysiol. 2011. PMID: 21525372 Free PMC article.
-
N-type calcium current, Cav2.2, is enhanced in small-diameter sensory neurons isolated from Nf1+/- mice.Neuroscience. 2014 Jun 13;270:192-202. doi: 10.1016/j.neuroscience.2014.04.021. Epub 2014 Apr 19. Neuroscience. 2014. PMID: 24755485 Free PMC article.
-
Heat hyperalgesia and mechanical hypersensitivity induced by calcitonin gene-related peptide in a mouse model of neurofibromatosis.PLoS One. 2014 Sep 3;9(9):e106767. doi: 10.1371/journal.pone.0106767. eCollection 2014. PLoS One. 2014. PMID: 25184332 Free PMC article.
References
-
- Baker MD, Bostock H. Low-threshold, persistent sodium current in rat large dorsal root ganglion neurons in culture. J Neurophysiol 77: 1503–1513, 1997 - PubMed
-
- Caffrey JM, Eng DL, Black JA, Waxman SG, Kocsis JD. Three types of sodium channels in adult rat dorsal root ganglion neurons. Brain Res 592: 283–297, 1992 - PubMed
Publication types
MeSH terms
Substances
Grants and funding
LinkOut - more resources
Full Text Sources
Research Materials
Miscellaneous