. 2010 Apr;103(4):2208-21.
doi: 10.1152/jn.00857.2009. Epub 2010 Feb 17.

Mechanism for the universal pattern of activity in developing neuronal networks

Affiliations

Mechanism for the universal pattern of activity in developing neuronal networks

Joël Tabak et al. J Neurophysiol. 2010 Apr.

Abstract

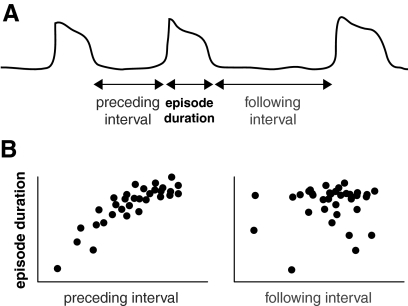
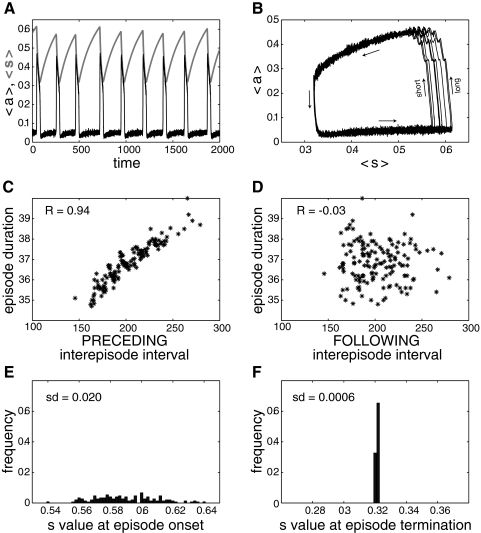
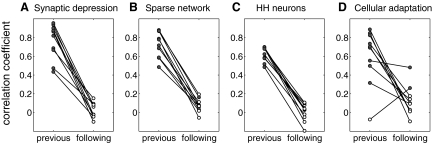
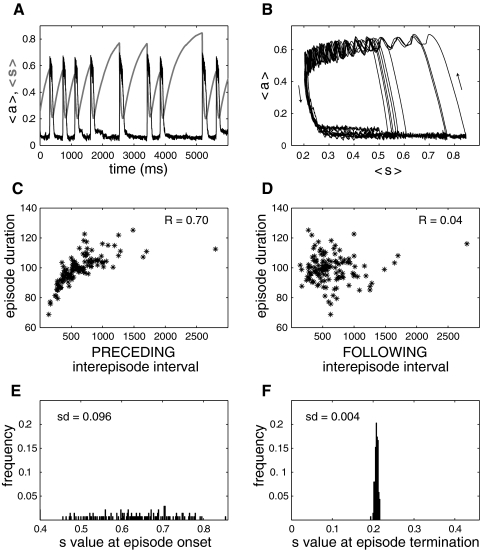
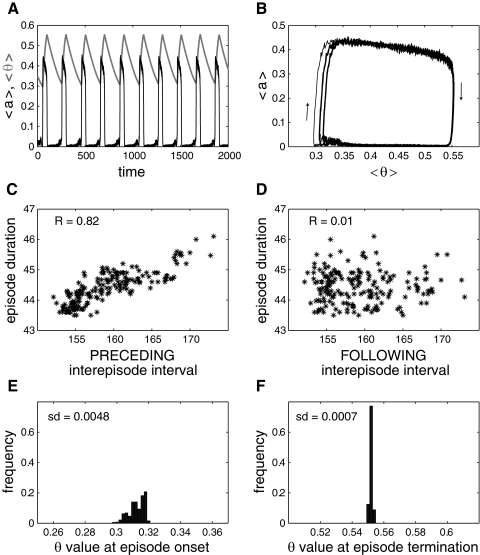
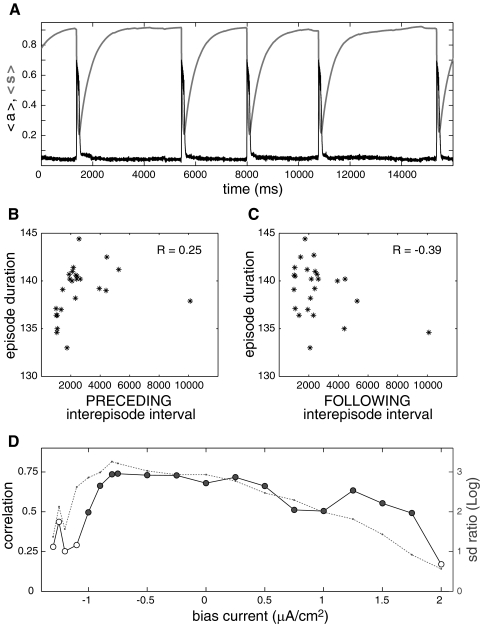
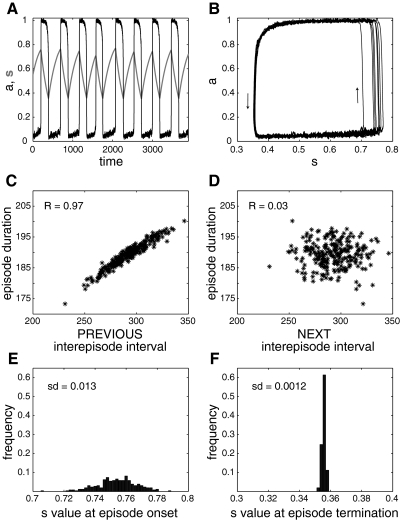
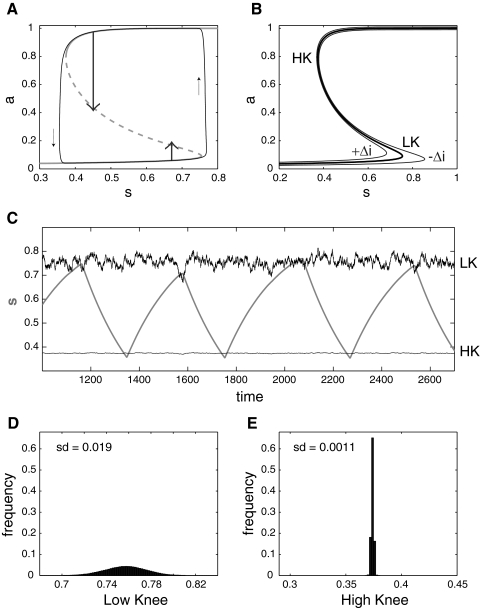
Spontaneous episodic activity is a fundamental mode of operation of developing networks. Surprisingly, the duration of an episode of activity correlates with the length of the silent interval that precedes it, but not with the interval that follows. Here we use a modeling approach to explain this characteristic, but thus far unexplained, feature of developing networks. Because the correlation pattern is observed in networks with different structures and components, a satisfactory model needs to generate the right pattern of activity regardless of the details of network architecture or individual cell properties. We thus developed simple models incorporating excitatory coupling between heterogeneous neurons and activity-dependent synaptic depression. These models robustly generated episodic activity with the correct correlation pattern. The correlation pattern resulted from episodes being triggered at random levels of recovery from depression while they terminated around the same level of depression. To explain this fundamental difference between episode onset and termination, we used a mean field model, where only average activity and average level of recovery from synaptic depression are considered. In this model, episode onset is highly sensitive to inputs. Thus noise resulting from random coincidences in the spike times of individual neurons led to the high variability at episode onset and to the observed correlation pattern. This work further shows that networks with widely different architectures, different cell types, and different functions all operate according to the same general mechanism early in their development.


Figures

Fig. 1.
Fig. 1.
Correlation pattern typically observed in developing and hyperexcitable networks. A: cartoon representation of spontaneous activity, showing episodic increases of the average firing rate in the network. B: scatter plots of episode duration and interepisode interval, showing a positive correlation between episode duration and preceding (not following) interepisode interval. Time scale ranges from 100 ms to 1 min for the episodes of activity.
Fig. 2.
Fig. 2.
Episodic activity and correlation pattern of the excitatory network of integrate-and-fire (I&F) neurons with synaptic depression and all-to-all coupling. A: time courses of activity, 〈a〉 (thin, black curve), and average recovery from depression, 〈s〉 (thick, light green curve). Note how the value of 〈s〉 at episode onset varies from episode to episode, while the value of 〈s〉 at episode termination remains almost constant. B: “phase plane” representation, where 〈a〉 is plotted as a function of 〈s〉 for each time point shown in A. This defines a trajectory with the bottom part of the trajectory corresponding to the interepisode intervals, the upper part corresponding to the episodes and the right and left parts corresponding to the transitions between episodes and silent intervals (arrows indicate direction of movement). This representation clearly shows the greater variability of episode onset than episode termination. Short, episode starting after a short interval; long, episode starting after a long interval. C: the correlation between episode duration and preceding interepisode interval is high. D: absence of correlation between episode duration and following interepisode interval. E: wide distribution of 〈s〉 values at episode onset. F: narrow distribution of 〈s〉 values at episode termination. sd, SD of the corresponding distribution.
Fig. 3.
Fig. 3.
Robustness of the correlation pattern to model implementation. Each plot indicates the correlation coefficient between episode duration and preceding or following interepisode interval obtained from 10 simulations. Filled circles indicate significant correlation (P < 0.01). A: results from a network of I&F neurons with synaptic depression and all-to-all coupling. Input currents were uniformly distributed on the interval [0.15, 1.15] (the minimal input current that results in spiking, or rheobase, is 1). Each simulation corresponds to a different, randomly chosen, distribution of bias currents. B: results from a network of I&F neurons with synaptic depression as in A, but with sparse (10%) connectivity. Here, all simulations used the same, uniformly spaced distribution of bias current on [0.15, 1.15], but differed in the connectivity matrix. For each simulation, each neuron was assigned to project to 10 randomly chosen postsynaptic neurons. C: results from a network of Hodgkin-Huxley neurons with synaptic depression and all-to-all coupling. Bias currents were uniformly distributed on the interval [−10, 5] (rheobase ∼3 μA/cm2). Each simulation corresponds to a different, randomly chosen, distribution of bias currents. D: results from a network of I&F neurons with cellular adaptation and all-to-all coupling. Both bias currents and strength of the adaptation process gθ were uniformly distributed on the interval [0.5, 1.5]. Each simulation corresponds to 2 different, randomly chosen, distributions for bias currents and gθ.
Fig. 4.
Fig. 4.
Episodic activity and correlation pattern of the excitatory network of Hodgkin-Huxley (HH) neurons with synaptic depression and all-to-all coupling. A: time courses of activity, 〈a〉 (thin, black curve), and average recovery from depression, 〈s〉 (thick, light green curve). B: “phase plane” trajectory. C: the correlation between episode duration and preceding interepisode interval is high. D: absence of correlation between episode duration and following interepisode interval. E: wide distribution of 〈s〉 values at episode onset. F: narrow distribution of 〈s〉 values at episode termination.
Fig. 5.
Fig. 5.
Episodic activity and correlation pattern of the excitatory network of I&F neurons with cellular adaptation and all-to-all coupling. A: time courses of activity, 〈a〉 (thin, black curve), and average adaptation 〈θ〉 (thick, light green curve). Note that the activity appears more regular than for the previous examples (Figs. 2 and 4). B: “phase plane” trajectory. C: the correlation between episode duration and preceding interepisode interval is high. D: absence of correlation between episode duration and following interepisode interval. E: distribution of 〈θ〉 values at episode onset. F: narrow distribution of 〈θ〉 values at episode termination.
Fig. 6.
Fig. 6.
Dependence of the correlation pattern on cell excitability. A: time course of activity (〈a〉, black) and recovery from depression (〈s〉, thick light green) for a network of 100 HH neurons with all-to-all coupling and synaptic depression. Input currents to the neurons are uniformly distributed on the interval [−10, 5], and an additional bias current of −1.2 μA/cm2 is applied to all cells of the network. Note that episodes occur after random amounts of time once 〈s〉 has reached its maximal value. B: absence of correlation between episode duration and preceding interepisode interval. C: absence of correlation between episode duration and following interepisode interval. D: correlation coefficient between episode duration and preceding interepisode interval (circles, black line) and variability of 〈s〉 at episode onset relative to variability at episode termination (dotted green line), plotted as a function of the bias current. The relative variability is measured as the log of the ratio of the SD of 〈s〉 at onset and at termination. For the most negative bias currents (≤ −1 μA/cm2), the correlation is not significant because the variability of 〈s〉 at episode onset is low. As the variability at onset increases, the correlation between episode duration and interepisode interval becomes significant and remains high until higher values of bias current lead to lower relative variability of 〈s〉 at episode onset.
Fig. 7.
Fig. 7.
Episodic activity and correlation pattern of the excitatory mean field model with synaptic depression. A: time courses of activity, a (thin, black curve), and average recovery from depression, s (thick, light green curve). The value of s at episode onset varies from episode to episode, whereas the value of s at episode termination remains almost constant, as for the network of spiking neurons (Fig. 2). Noise amplitude was 0.01. B: phase plane representation, where a is plotted as a function of s for each time point shown in A. C: the correlation between episode duration and preceding interepisode interval is high. D: absence of correlation between episode duration and following interepisode interval. E: wide distribution of s values at episode onset. F: narrow distribution of s values at episode termination. These distributions compare with the ones shown in Figs. 2 and 4.
Fig. 8.
Fig. 8.
Phase plane argument for higher variability at episode onset. A: the trajectory of the deterministic model tracks low and high branches of the a-nullcline (the S-shaped curve). Episode onset and termination occur at the knees of the S-curve: LK, low knee, the transition point from silent to active phase; HK, high knee, the transition point from active to silent phase. Note that the trajectory slightly overshoots the knees. When the system is close to the low knee during the silent phase, a small perturbation (short upward arrow) brings it above threshold (dashed portion of the S-curve). When the system is close to the high knee during the episode, a stronger perturbation (long downward arrow) is needed to bring it below threshold. B: effect of an input on the a-nullcline. Thick curve, control position as in A; thin curves, effect of small input ± Δi with Δi = 0.01. The low knee is more affected than the high knee. The ratio of their horizontal displacements is given by Δslkshk = (slk/shk)(ahk/alk) = 17.4 for the parameters given in Table 2. C: portion of the time course of s from Fig. 7A (thick green curve), together with the time courses of the knees positions slk (LK) and shk (HK). The knees positions are filtered according to τkdLK/dt = slkLK (and similarly for the high knee). Episode onset occurs when s passes above slk, whereas episode termination occurs when s falls below shk. D: distribution of all slks obtained during the entire simulation. E: distribution of all shks obtained during the entire simulation. The ratio of their SD was 17.4. Compare these distributions with the distributions shown in Fig. 7, E and F.

Similar articles

Cited by

References

    1. Ben Ari Y. Developing networks play a similar melody. Trends Neurosci 24: 353–360, 2001 - PubMed
    1. Butts DA, Feller MB, Shatz CJ, Rokhsar DS. Retinal waves are governed by collective network properties. J Neurosci 19: 3580–3593, 1999 - PMC - PubMed
    1. Chub N, O'Donovan MJ. Post-episode depression of GABAergic transmission in spinal neurons of the chick embryo. J Neurophysiol 85: 2166–2176, 2001 - PubMed
    1. Compte A, Sanchez-Vives MV, McCormick DA, Wang XJ. Cellular and network mechanisms of slow oscillatory activity (<1 Hz) and wave propagations in a cortical network model. J Neurophysiol 89: 2707–2725, 2003 - PubMed
    1. Darbon P, Scicluna L, Tscherter A, Streit J. Mechanisms controlling bursting activity induced by disinhibition in spinal cord networks. Eur J Neurosci 15: 671–683, 2002 - PubMed

Publication types