. 2010 Apr;103(4):2139-57.
doi: 10.1152/jn.00709.2009. Epub 2010 Feb 17.

Response properties of neurons in primary somatosensory cortex of owl monkeys reflect widespread spatiotemporal integration

Affiliations

Response properties of neurons in primary somatosensory cortex of owl monkeys reflect widespread spatiotemporal integration

Jamie L Reed et al. J Neurophysiol. 2010 Apr.

Abstract

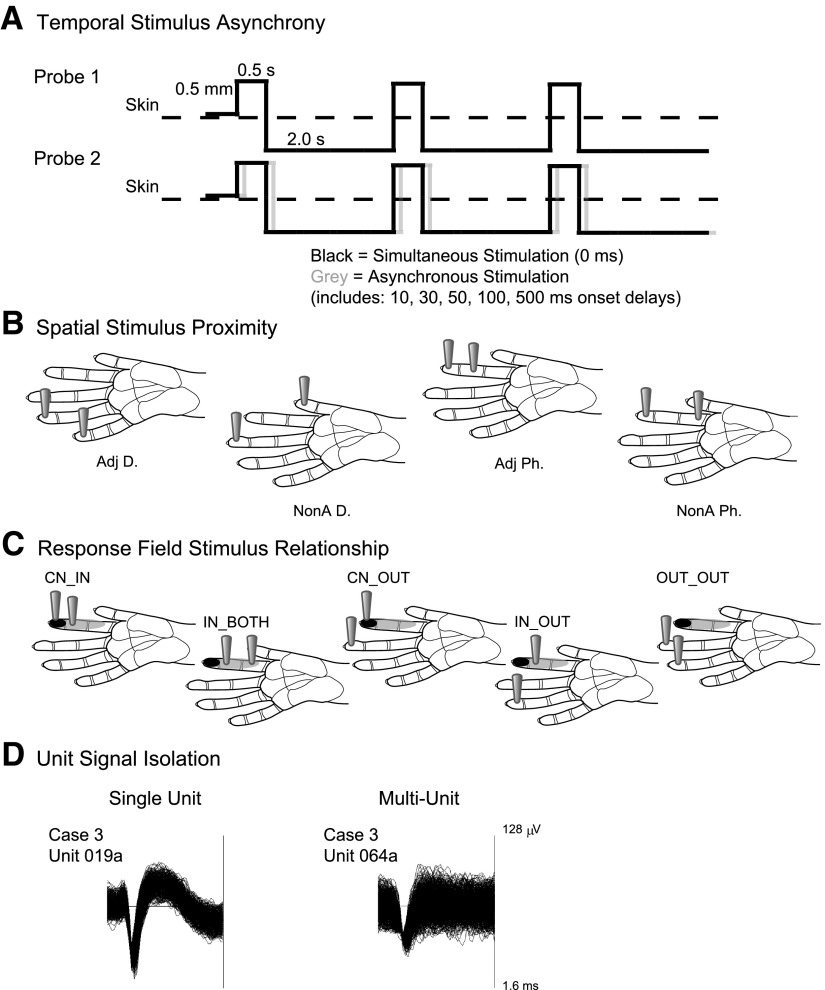
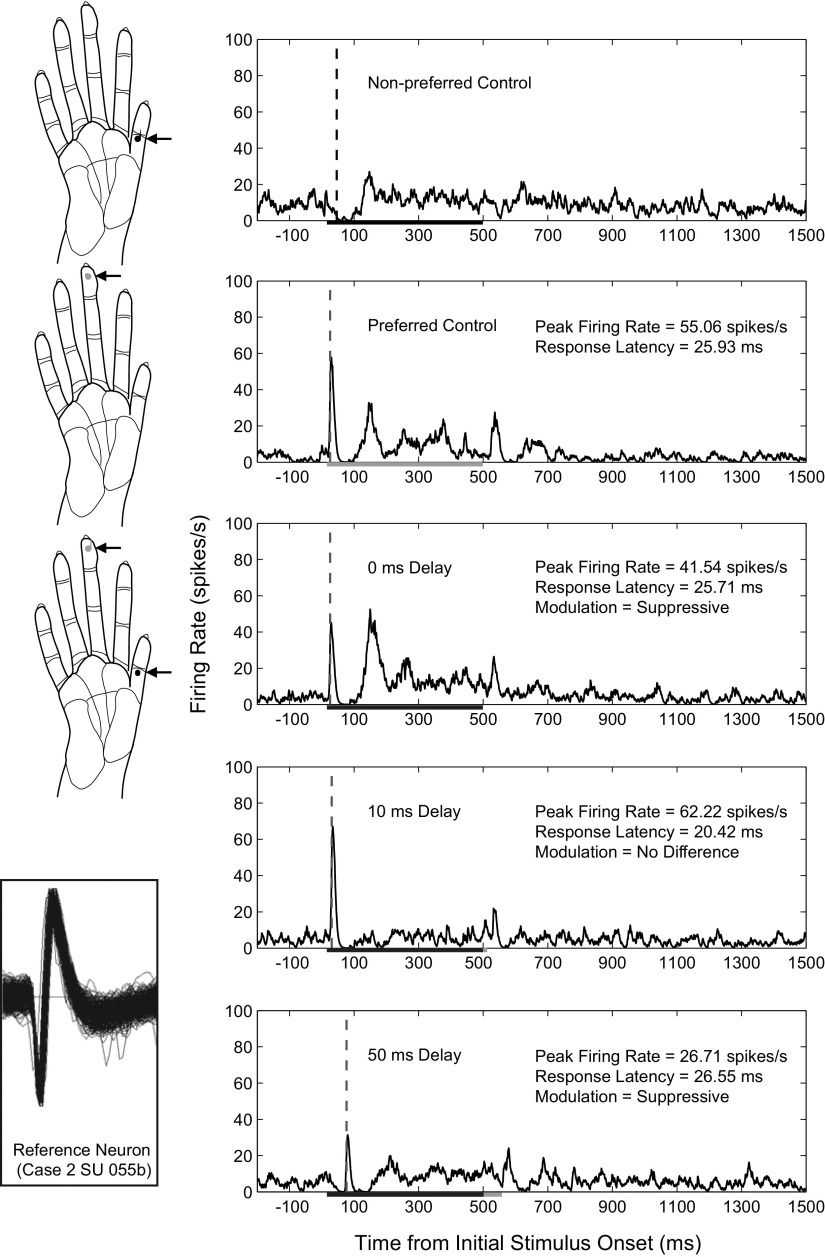
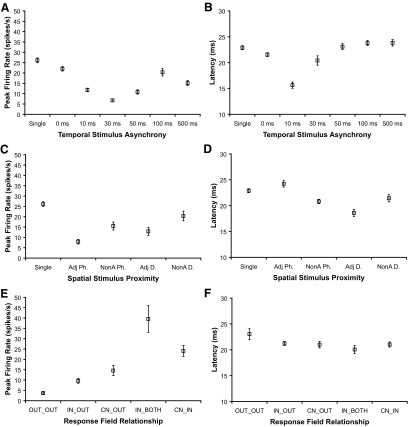
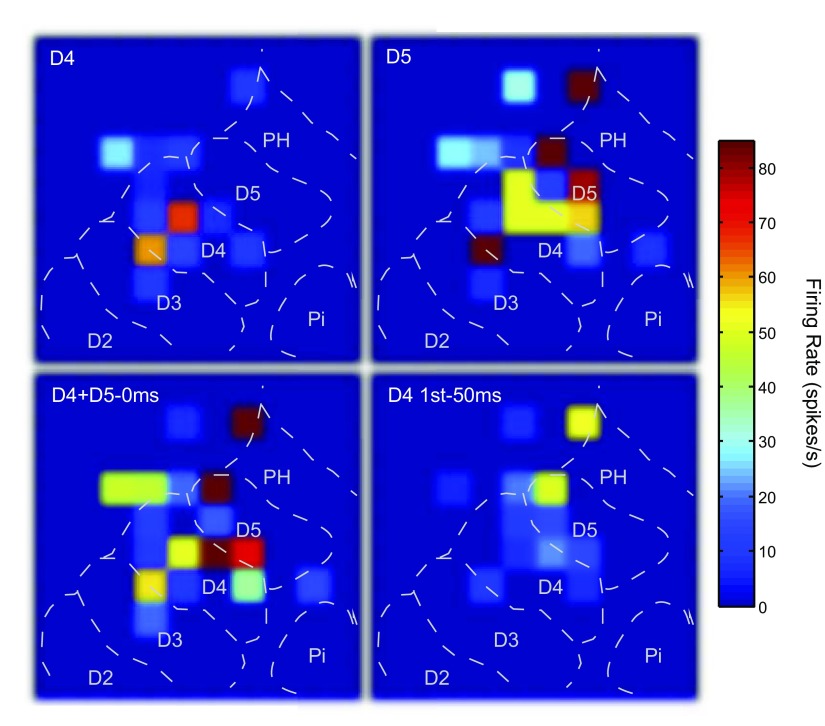
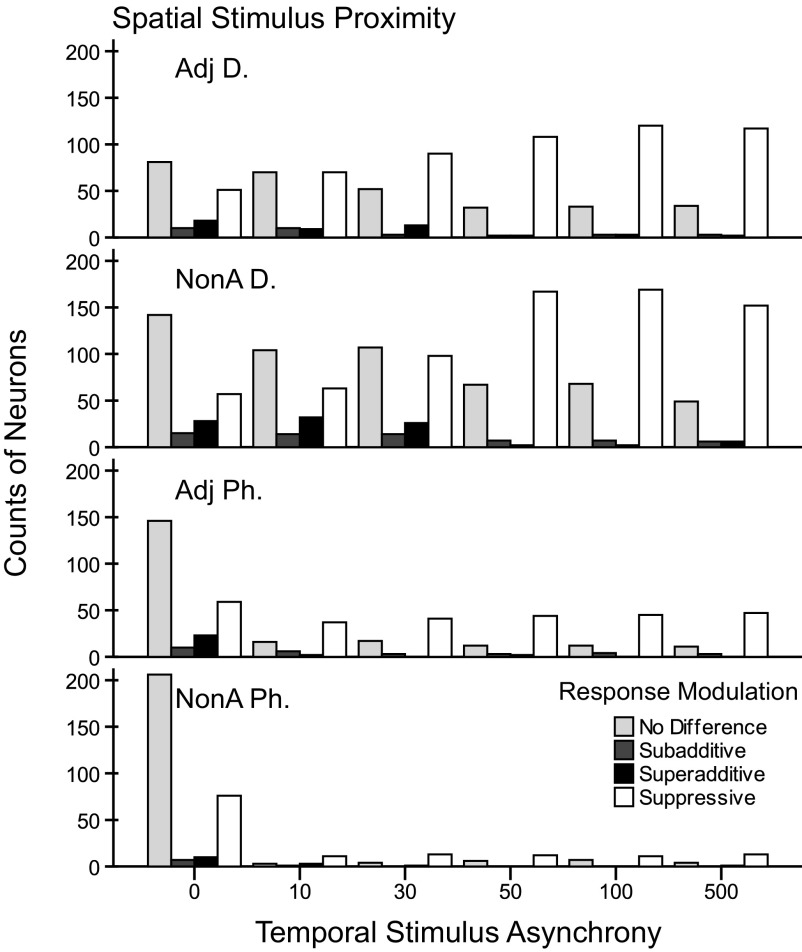
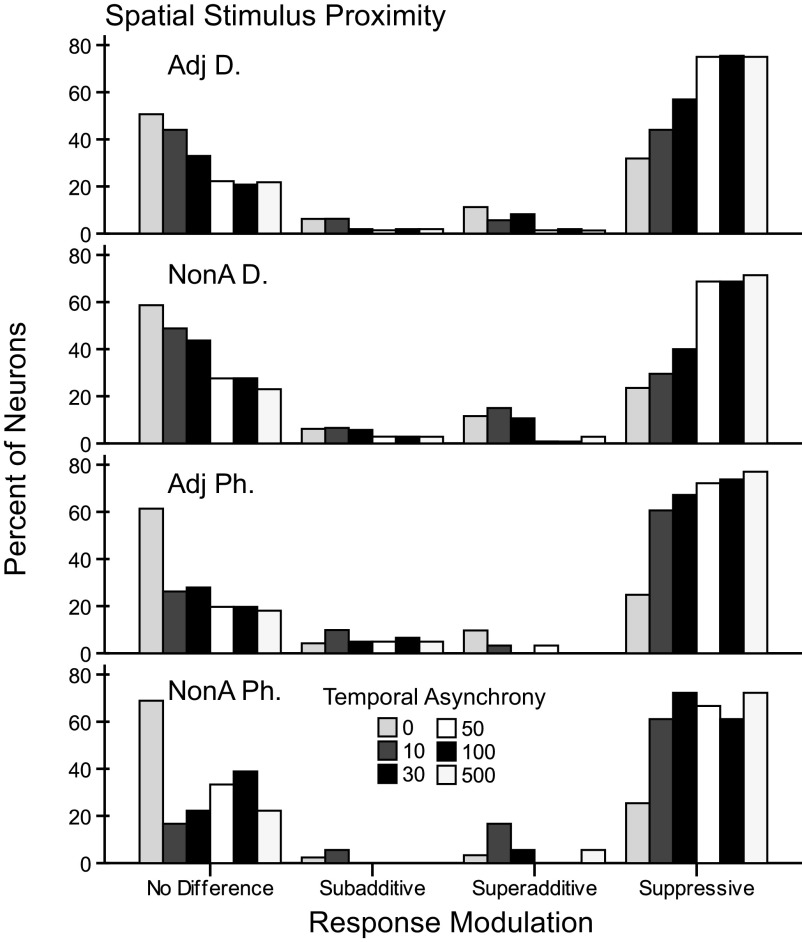
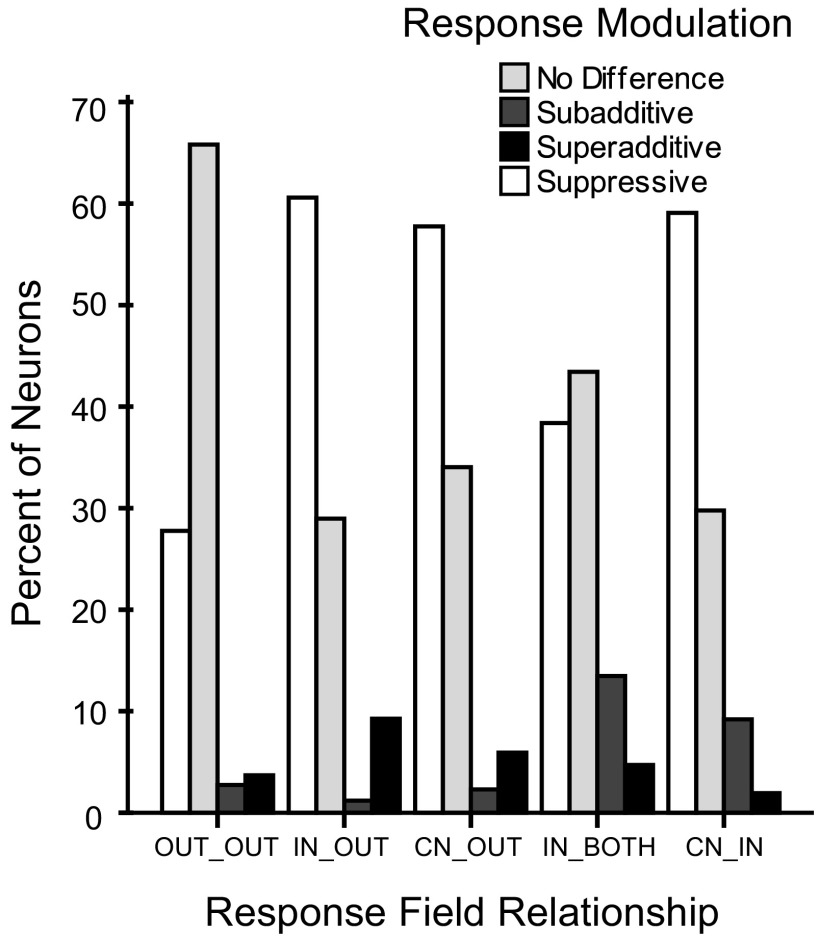
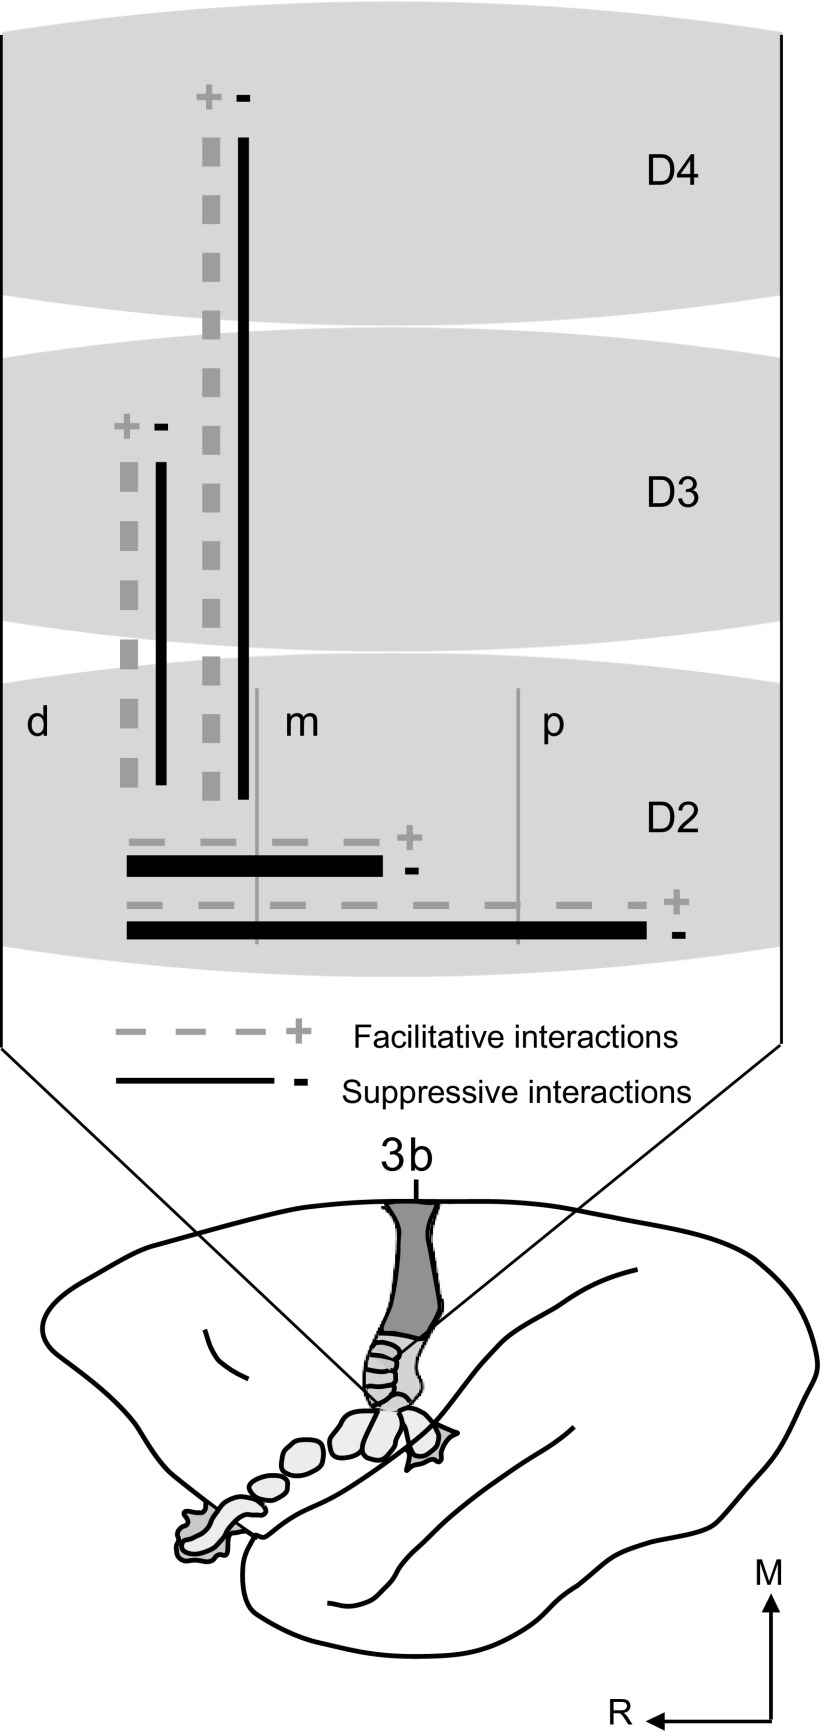
Receptive fields of neurons in somatosensory area 3b of monkeys are typically described as restricted to part of a single digit or palm pad. However, such neurons are likely involved in integrating stimulus information from across the hand. To evaluate this possibility, we recorded from area 3b neurons in anesthetized owl monkeys with 100-electrode arrays, stimulating two hand locations with electromechanical probes simultaneously or asynchronously. Response magnitudes and latencies of single- and multiunits varied with stimulus conditions, and multiunit responses were similar to single-unit responses. The mean peak firing rate for single neurons stimulated within the preferred location was estimated to be ∼26 spike/s. Simultaneous stimulation with a second probe outside the preferred location slightly decreased peak firing rates to ∼22 spike/s. When the nonpreferred stimulus preceded the preferred stimulus by 10-500 ms, peak firing rates were suppressed with greatest suppression when the nonpreferred stimulus preceded by 30 ms (∼7 spike/s). The mean latency for single neurons stimulated within the preferred location was ∼23 ms, and latency was little affected by simultaneous paired stimulation. However, when the nonpreferred stimulus preceded the preferred stimulus by 10 ms, latencies shortened to ∼16 ms. Response suppression occurred even when stimuli were separated by long distances (nonadjacent digits) or long times (500 ms onset asynchrony). Facilitation, though rare, occurred most often when the stimulus onsets were within 0-30 ms of each other. These findings quantify spatiotemporal interactions and support the hypothesis that area 3b is involved in widespread stimulus integration.


Figures

Fig. 1.
Fig. 1.
Schematic representations of data categories. A: the pattern of stimulation is depicted by solid lines indicating the duration the stimulus probe indents the skin (0.5 s), the depth of indentation (0.5 mm), and the duration the stimulus probe is off of the skin per stimulus cycle (2.0 s). Paired stimulation, indicated by the schematics of probes 1 and 2, may be simultaneous or asynchronous. To depict asynchronous stimulation generally, the gray solid line representing probe 2 is shifted relative to the black solid line. The 2 probes are presented to different skin sites on the hand; however, the schematic depicts the overlap in contact time of the stimuli presented via probes 1 and 2. B: the spatial stimulus relationships were divided into 4 categories. Locations of the 2 stimulus probes on schematics of the owl monkey hand illustrate the proximity category. Scale bars on hand diagrams are 1 mm. Adj D, adjacent digits (or palm pads); NonA D, nonadjacent digits (or palm pads); Adj P, adjacent phalanges; NonA Ph, nonadjacent phalanges. C: the response field category is determined by the unit's response field relative to the stimulation location. Black shading on schematics of the owl monkey hand indicates the center of the response field for a hypothetical unit. Gray shading on the hand indicates locations inside the response field but outside the center “hotspot” for the hypothetical reference unit. The locations of the 2 gray probes indicate the location of the stimulation relative to the response field for each response field category. Scale bars on hand diagrams are 1 mm. D: data were also classified by the quality of the signal isolation into single or multiunits. Examples of each unit type are shown from monkey case 3. The trace window for each unit type shown spanned 128 μV and 1.6 ms.
Fig. 2.
Fig. 2.
Schematic reconstructions show 100-electrode array placement in area 3b of 3 owl monkey cases. A: a schematic of the owl monkey brain is shown with the area 3b body representations highlighted as area 3a and area 1 neurons tended not to respond well to light tactile stimulation under the anesthetic conditions of these experiments. Gray shading indicates the area 3b hand representation. Light gray shading indicates the area 3b face and oral cavity representations, portions of which are hidden from the cortical surface, but are revealed by “unfolding” the schematic representation. Dark gray indicates the rest of 3b. B–D: electrode locations in each owl monkey case were approximated based on examination of myelin-stained sections of flattened cortex in which area 3b stains more darkly than surrounding areas, with a myelin-poor septum indicating the border of the hand and face representation. Occasionally, myelin-poor septa can seen between digit representations in flattened cortex preparations, but in our cases, we used the results of receptive field mapping during recording experiments to estimate the digit and palm pad representations. The placements of the 4 × 4 mm array in each case tended to cover a large part of the hand representation. The 1 mm scale bar corresponds to the size of the array schematics for all 3 owl monkey cases.
Fig. 3.
Fig. 3.
Example histograms from a single unit depict peak firing rate and latency changes across selected spatiotemporal stimulus conditions. Arrows point to dots on the diagrams of the owl monkey hand that indicate the stimulus locations on digits 1 and 3 for a series of recordings in monkey case 2. Histograms are shown for the neuron's responses when the 2 locations were stimulated individually, then for both locations simultaneously, and finally for 2 stimulus blocks in which the nonpreferred, or conditioning, stimulus was presented at 10 and 50 ms before the onset of the preferred stimulus. Stimulation was presented in blocks of 100 trials. Histograms are smoothed by a spike density function as described in methods. Vertical dashed lines indicate when the latency was determined as described in methods. The duration for each stimulus was 500 ms as indicated by the line on the x axis; therefore paired stimulation overlapped in time for all stimulus onset delays tested except for 500 ms (not shown). The measures we examined included the peak firing rate within 50 ms of the preferred stimulus onset and the associated latency of that response. The peak firing rates and response latencies following stimulation of the preferred location are given for each excitatory response. The firing rate modulation category is listed for examples of paired stimulation. While the 10 ms delay resulted in an average peak firing rate value that was ∼13% larger than the response during control stimulation alone, the analysis for firing rate modulation found that this difference was not statistically significant in this example. Inset: the trace of the single unit in each histogram is shown at the lower left corner in a trace window that spanned 128 μV and 1.6 ms.
Fig. 4.
Fig. 4.
Main effects for peak firing rate and response latency measures from single units across spatial and temporal stimulus conditions. Estimated mean values from generalized estimating equations analysis of 309 single units are shown with error bars representing ±1 SE for all panels. Results for peak firing rate are shown in A, C, and E; results for latency are shown in B, D, and F. A: Means of peak firing rate values (spike/s) are plotted for each temporal stimulation category comparing the preferred control stimulation (single) to paired stimulation at 0, 10, 30, 50, 100, and 500 ms stimulus onset asynchronies. Dual-site stimulation suppressed peak firing rates relative to single-site stimulation. A stimulus onset asynchrony of 30 ms resulted in the greatest suppression of peak firing rate, and this suppression was significantly different from all other stimulus categories (P < 0.0005 for all comparisons). B: means of response latencies (ms) plotted for each temporal stimulation condition show that 0 and 10 ms stimulus onset delays resulted in faster latencies than single-site control stimulation (P = 0.003 and P < 0.0005, respectively). C: means of peak firing rates are plotted for each spatial proximity condition in which the stimuli were presented on separate adjacent digit sites (Adj D), separate nonadjacent digit sites (NonA D), within a single digit on adjacent phalanges (Adj Ph), or within a single digit on nonadjacent phalanges (NonA Ph). Dual-site stimulation suppressed peak firing rates compared with single-site stimulation for all conditions except when nonadjacent digits were stimulated (P = 0.074). On average, peak firing rates were higher in response to stimulation on NonA D than Adj Ph, (P < 0.0005). D: latencies did not vary greatly with spatial stimulus proximity, but latencies were slightly faster in response to stimulation on Adj D and NonA Ph compared with single-site stimulation (P < 0.0005 for both comparisons). E: means of peak firing rate values are plotted for each type of relationship of the response field to the stimulus location. Peak firing rates were lower when the stimuli were outside of the response field (OUT_OUT) compared with all other conditions (P < 0.0005 for all comparisons). CN_IN was not different from IN_BOTH (P = 0.272) or CN_OUT (P = 0.087), and IN_OUT was not different from CN_OUT (P = 0.713). F: Latencies were slightly but not significantly longer when both stimuli were presented outside of the neuron's response field (OUT_OUT) compared with all other response field stimulus relationships. CN, response field center; IN, in response field; OUT, outside response field.
Fig. 5.
Fig. 5.
Peak firing rate values represented across the 100-electrode array under selected stimulus conditions. Color maps of the peak firing rate responses across the array were generated in Matlab with hot colors representing higher peak firing rates. Each square represents an electrode in the array and the peak firing rate value during the 50 ms response window. Electrodes from which no significant responses were obtained during the stimulations shown are indicated in dark blue (no squares). The dashed lines indicate approximate locations of the representations within area 3b in monkey 3. Top left: the responses when a single site on distal digit 4 (D4) was stimulated for 100 trials. Top right: the responses when a single site on the adjacent digit 5 (D5) was stimulated. Activity overall was greater during D5 stimulation, but both single site stimulation conditions show that the hotspots of activity occurred in the expected representations, but the activity could cross into adjacent representations and be nonuniform. Bottom left: both single site locations were stimulated simultaneously, resulting in a pattern of activity that one would not expect from simple summation across electrodes. Bottom right: the responses when D4 was stimulated 50 ms before D5 was stimulated, with the responses after D5 stimulation captured. The responding electrodes appear to show suppressed or unchanged responses.
Fig. 6.
Fig. 6.
Counts of responses to dual-site stimulation categorized by spatial and temporal stimulation parameters. Individual bar shades indicate the classes of firing rate modulation in response to paired stimulation which occurred in these data: “no difference” compared with the response to the preferred control, “subadditive” compared with the summation of the responses of both controls, “superadditive” compared with the summation of the responses of the controls, and “suppressive” compared with the response to the preferred control. The types of paired stimulation conditions are grouped on the x axis referring to the stimulus onset asynchronies from 0 to 500 ms in which the preferred stimulus was always presented after the nonpreferred stimulus. The panels show the total counts of these categories for each of the four tested stimulus proximity categories. Fewer recordings were made with paired stimuli within a single digit (Adj Ph, NonA Ph). Suppression and no difference compared with the preferred control stimulation dominate the modulation classification types. Note the pattern such that many responses are classified as no difference during stimulation at short stimulus onset delays (0–30 ms) and there are fewer at longer delays (50–500 ms). Responses classified as suppressive show the reverse effect, particularly in the panels for adjacent and nonadjacent digit stimulation conditions. Facilitation (subadditive, superadditive) occurred less often, but was predominantly found when the delays were short (0–30 ms).
Fig. 7.
Fig. 7.
Percentages of response types for firing rate modulation categorized by spatial and temporal stimulation parameters. Four classes of firing rate modulation in response to paired stimulation occurred in these data: no difference, subadditive, superadditive, and suppressive, and these are displayed on the x axis. Individual bar shades indicate the paired stimulation type referring to the stimulus onset asynchronies in which the preferred stimulus was always presented after the nonpreferred stimulus. The panels show the total counts of these categories for each of the 4 tested stimulus proximity categories. Note that fewer recordings were made for the categories stimulating within a single digit (Adj Ph, NonA Ph). Percent on the y axis refers to the percentage of occurrences of each response type category, calculated within each panel for the four proximity categories. This view of the same data from Fig. 6 shows that when stimuli were presented at short delays (0–30 ms), response types tended to be no difference and facilitative (subadditive, superadditive). At these short delays, paired stimuli presented within a single digit (Adj Ph, NonA Ph) were suppressive modulators of firing rate in greater proportions than when paired stimuli were presented on adjacent or nonadjacent digits.
Fig. 8.
Fig. 8.
Percentages of response types for firing rate modulation categorized by response field relationships. The response field categories are shown on the x axis. On the y axis, the percentages of occurrences of the four response classes of “no difference”, “subadditive”, “superadditive”, and “suppressive” were determined within each response field relationship category. The response classes were distributed across the response field categories rather than grouped within the categories.
Fig. 9.
Fig. 9.
A summary diagram of the spatiotemporal interactions resulting from functional interactions between parts of the hand representation in area 3b. Representations of 3 digits (D2, D3, D4) in area 3b are shown above the schematic of the owl monkey brain indicating the location of area 3b. These represent stimulation applied to adjacent and nonadjacent locations rather than to the specific digits. One digit is divided into distal (d), middle (m), and proximal (p) sections to represent the stimulation on phalanges within each digit. Line thickness between sites is an approximate representation of the proportion of suppression or facilitation recorded from the selected locations. Black lines refer to suppressive interactions (−) that occurred when stimuli were presented on the paired locations indicated, and these lines are solid to indicate that suppressive interactions were found at all stimulus onset asynchronies tested, from 0 to 500 ms. Gray lines refer to facilitative interactions (+) that occurred when stimuli were presented on the paired sites indicated. All of the gray lines are dashed to indicate that facilitative interactions tended to dominate during short stimulus onset delays from 0 to 30 ms. The most suppressive interactions tended to occur when adjacent phalanges were stimulated and the most facilitative interactions tended to occur when adjacent and nonadjacent digits were stimulated.

Similar articles

Cited by

References

    1. Allman J, Miezin F, McGuinness E. Stimulus specific responses from beyond the classical receptive field: neurophysiological mechanisms for local-global comparisons in visual neurons. Annu Rev Neurosci 8: 407–430, 1985. - PubMed
    1. Alvarado JC, Vaughan JW, Stanford TR, Stein BE. Multisensory versus unisensory integration: contrasting modes in the superior colliculus. J Neurophysiol 97: 3193–205, 2007. - PubMed
    1. Armstrong-James M, Fox K. Spatiotemporal convergence and divergence in the rat S1 “barrel” cortex. J Comp Neurol 236: 265–281, 1987. - PubMed
    1. Arnold PB, Li CX, Waters RS. Thalamocortical arbors extend beyond single cortical barrels: an in vivo intracellular tracing study in rat. Exp Brain Res 136: 152–168, 2001. - PubMed
    1. Berwick J, Redgrave P, Jones M, Hewson-Stoate N, Martindale J, Johnston D, Mayhew JEW. Integration of neural responses originating from different regions of the cortical somatosensory map. Brain Res 1030: 284–293, 2004. - PubMed

Publication types

LinkOut - more resources