. 2010 Apr;103(4):2285-300.
doi: 10.1152/jn.00360.2009. Epub 2010 Feb 17.

Differences in movement mechanics, electromyographic, and motor cortex activity between accurate and nonaccurate stepping

Affiliations

Differences in movement mechanics, electromyographic, and motor cortex activity between accurate and nonaccurate stepping

Irina N Beloozerova et al. J Neurophysiol. 2010 Apr.

Abstract

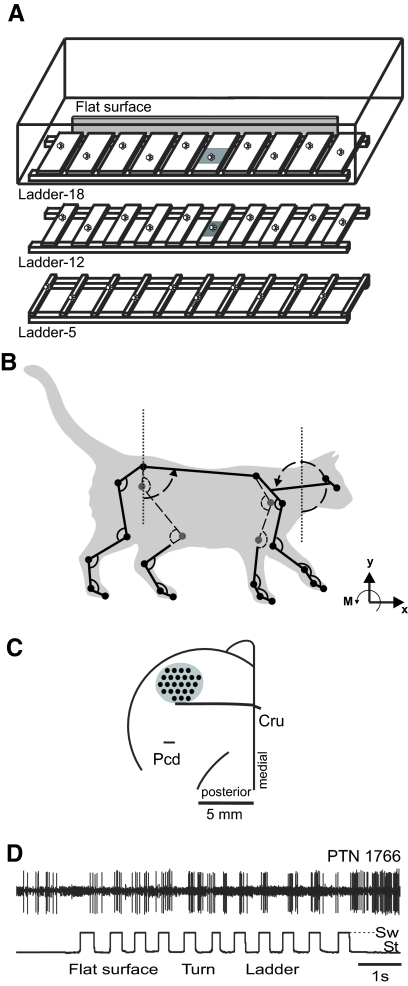
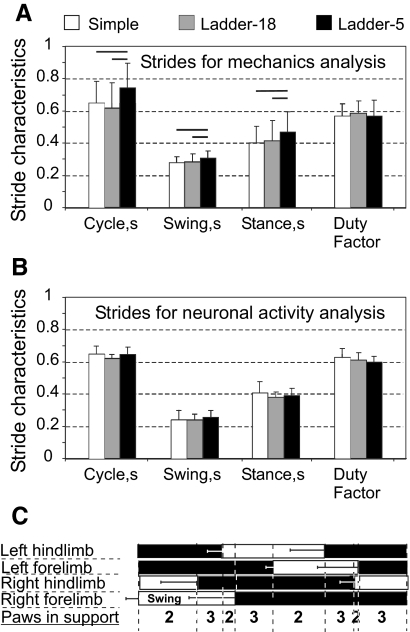
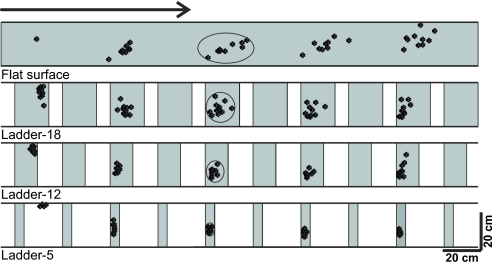
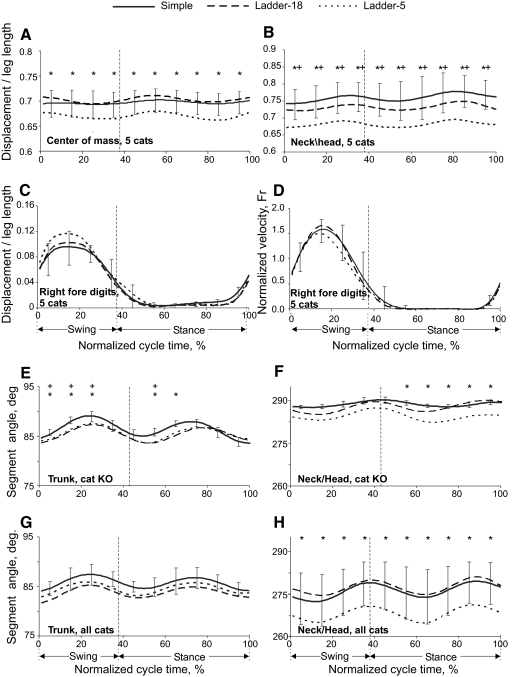
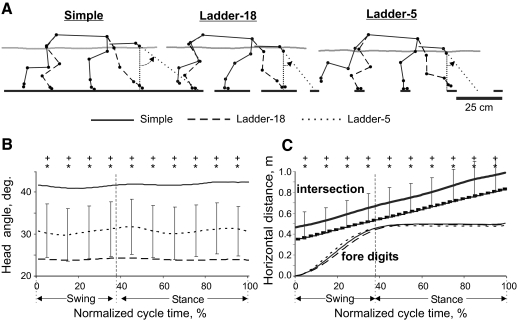
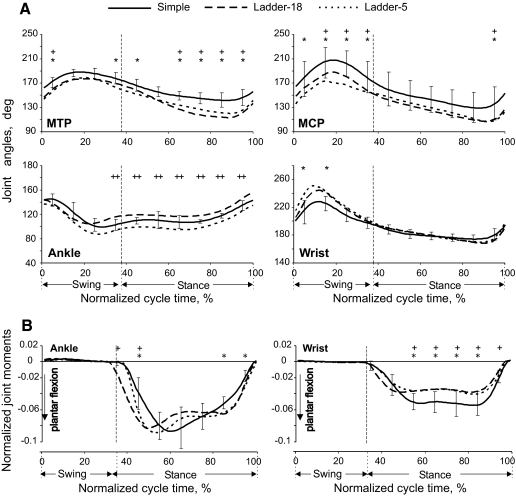
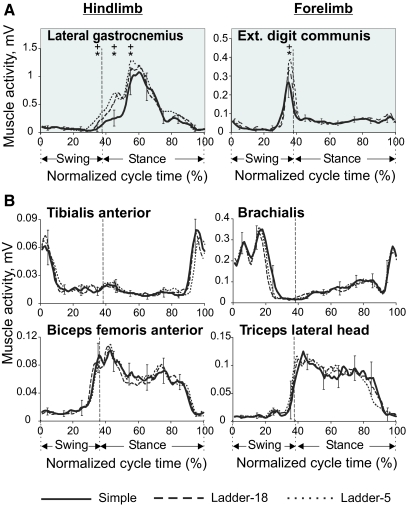
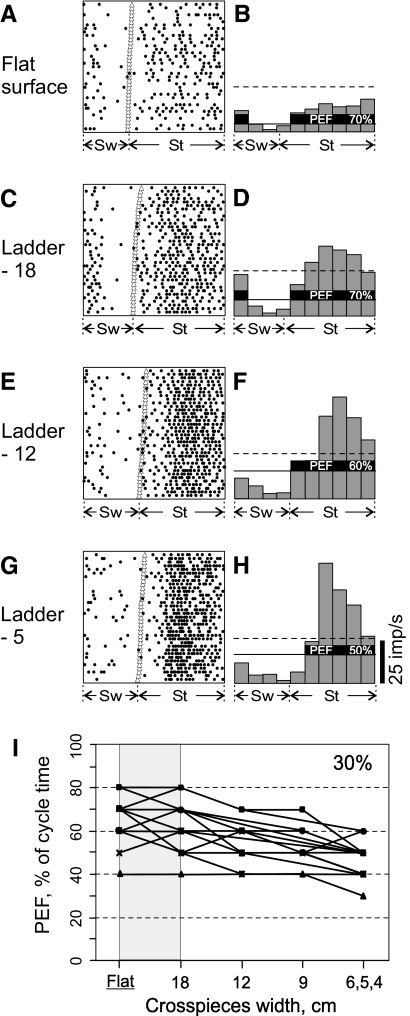
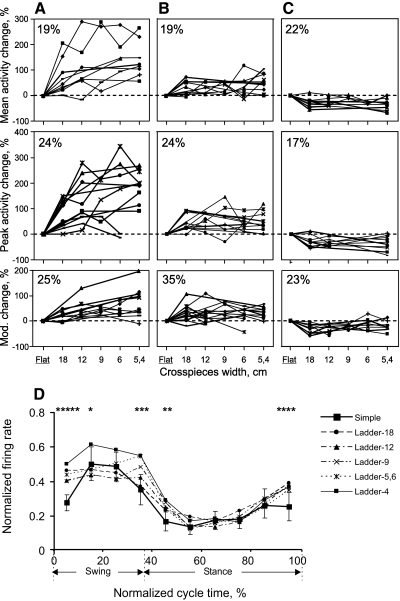
What are the differences in mechanics, muscle, and motor cortex activity between accurate and nonaccurate movements? We addressed this question in relation to walking. We assessed full-body mechanics (229 variables), activity of 8 limb muscles, and activity of 63 neurons from the motor cortex forelimb representation during well-trained locomotion with different demands on the accuracy of paw placement in cats: during locomotion on a continuous surface and along horizontal ladders with crosspieces of different widths. We found that with increasing accuracy demands, cats assumed a more bent-forward posture (by lowering the center of mass, rotating the neck and head down, and by increasing flexion of the distal joints) and stepped on the support surface with less spatial variability. On the ladder, the wrist flexion moment was lower throughout stance, whereas ankle and knee extension moments were higher and hip moment was lower during early stance compared with unconstrained locomotion. The horizontal velocity time histories of paws were symmetric and smooth and did not differ among the tasks. Most of the other mechanical variables also did not depend on accuracy demands. Selected distal muscles slightly enhanced their activity with increasing accuracy demands. However, in a majority of motor cortex cells, discharge rate means, peaks, and depths of stride-related frequency modulation changed dramatically during accurate stepping as compared with simple walking. In addition, in 30% of neurons periods of stride-related elevation in firing became shorter and in 20-25% of neurons activity or depth of frequency modulation increased, albeit not linearly, with increasing accuracy demands. Considering the relatively small changes in locomotor mechanics and substantial changes in motor cortex activity with increasing accuracy demands, we conclude that during practiced accurate stepping the activity of motor cortex reflects other processes, likely those that involve integration of visual information with ongoing locomotion.


Figures

Fig. 1.
Fig. 1.
Experimental setup. A: locomotion tasks: simple walking on a flat surface (simple locomotion) and walking along a horizontal ladder with crosspieces 18-, 12-, or 5-cm wide (complex locomotion). Paw prints on the crosspieces of the ladders schematically show placements of cat forelimb paws. The shaded area denotes a force platform. B: the cat model. Orientation of each segment was determined as the angle between the negative direction of the vertical axis and the longitudinal segment axis directed from the distal end of the segment to the proximal one, as indicated for the head/neck segment. C: a scheme of the recording area within the forelimb representation of the left motor cortex. The microelectrode entry points into the cortex (cortical plate openings through which penetrations have been made) were combined from all cats and shown by black circles (Cru, cruciate sulcus; Pcd, postcruciate dimple). D: a sample record of discharge of a pyramidal tract projecting neuron (PTN) during simple and complex locomotion. The bottom trace shows the swing (Sw, deflection up) and stance (St, deflection down) phases of the step cycle of the right forelimb recorded by an electromechanical sensor.
Fig. 2.
Fig. 2.
Characteristics of the step cycle during different locomotion tasks. A: averaged durations of the cycle, the swing and stance phases, and the duty factor (the ratio of stance duration to cycle duration) for the 5 cats, data from which were included in full-body mechanical analysis. B: same as A for the 3 cats, data from which were included in motor cortex activity analysis. The horizontal lines above bars indicate statistically significant (P < 0.05) differences between tasks (t-test). C: a stride diagram derived from simple locomotion of 5 cats used for mechanical analysis. Empty bars indicate the swing phase and black bars the stance phase of each limb. Horizontal error bars show SD. Four periods of 2-limb support and 4 periods of 3-limb support in one stride of the right forelimb are marked, with the walk stride formula 2–3–2–3–2–3–2–3.
Fig. 3.
Fig. 3.
A typical distribution of right forelimb paw prints recorded from one animal (N3) during 10 walking trials performed in each condition: on a flat surface (simple locomotion) and along ladders with crosspieces 18, 12, and 5 cm wide (complex locomotion). View from above. The direction of the cat's progression is shown by the arrow on the top. For simple locomotion, paw prints are adjusted to start in the same position. For ladder tasks, note similarly small variability of paw prints at the start of walkway (±2 cm in the direction of progression). The first paw placement during ladder-5 locomotion was between the crosspieces. Ellipses enclose approximate areas in which 95% of paw prints were found.
Fig. 4.
Fig. 4.
Displacements and orientation of body segments during simple and complex locomotion. A and B: vertical displacements of the general center of mass (GCM) (A) and the neck/head segment (B, as defined in Fig. 1B). C and D: vertical displacement (C) and horizontal velocity (D) of forelimb digits. E and F: averaged orientation angles of trunk (E) and neck/head (F) segments during simple and complex locomotion of cat KO. G and H: the same as E and F when averaged across 5 cats. Vertical dashed lines separate the swing and stance phases. SDs were similar across all tasks and for clarity are shown only for simple locomotion. Asterisk (*) indicates significant (P < 0.05, post hoc t-test) difference between simple and ladder-5 locomotion; + symbol indicates significant (P < 0.05, post hoc t-test) difference between simple locomotion and ladder-18 task.
Fig. 5.
Fig. 5.
Orientation of the head during locomotion tasks with different accuracy demands. A: representative stick figures of one cat (BL) near left forelimb paw contact during simple and complex locomotion. The right side of the body is indicated by the continuous line and the left side, by the dashed line. The trajectory of the GCM is shown by a gray line. Dotted lines show the angle between the long head axis and the vertical. B: averaged head angles during simple and complex locomotion. SDs during simple locomotion exceeded head angle ranges depicted in the plot and therefore are shown for ladder-5 task only. C: intersection: averaged horizontal position of the intersection point between the ground and the head axis during different tasks. SDs were similar across all tasks and for clarity are shown only for simple locomotion. C: fore digits: horizontal displacement of the leading forelimb digits. Other designations as in Fig. 4.
Fig. 6.
Fig. 6.
Distal joint angles and moments of the hindlimb (left panels) and forelimb (right panels) during simple and complex locomotion. Designations as in Fig. 4.
Fig. 7.
Fig. 7.
Activity of selected limb muscles during 3 complex locomotion tasks. A: typical examples of the averaged activity patterns of muscles whose activity was related to accuracy demands. Each panel shows a representative activity of an individual muscle, which was averaged over 10–25 strides of each locomotion task, all recorded during one session (see methods for stride selection). SDs were similar across all tasks and for clarity are shown for ladder-18 task only. B: typical examples of the averaged activity patterns of flexor and extensor fore- and hindlimb muscles whose activity was not related to accuracy demands.
Fig. 8.
Fig. 8.
Period of elevated activity (period of elevated firing [PEF]), shortens as demand on accuracy of stepping increases. A and B: activity of a pyramidal tract projecting neuron during simple locomotion is presented as a raster of 35 step cycles (A) and as a histogram (B). In the raster, the duration of step cycles is normalized to 100% and the raster is rank-ordered according to the duration of the swing phase. The beginning of the stance phase in each stride is indicated by an open triangle. In the histogram, the horizontal dashed line shows the level of activity at rest. The horizontal continuous line shows the level above which the activity was considered “elevated” (see methods); and the duration of PEF is expressed as a portion of the step cycle that it encompasses, 70%. C and D: activity of the same neuron during ladder-18 locomotion. PEF has the same duration as that during simple locomotion. E and F: activity of the same neuron during ladder-12 locomotion. The portion of step cycle that includes PEF decreased to 60%. G and H: activity of the same neuron during ladder-5 locomotion. The portion of step cycle that PEF encompassed decreased further to 50%. I: durations of PEFs across locomotion tasks with different accuracy demands of all 19 neurons in which they progressively decreased as the width of ladder's crosspieces decreased.
Fig. 9.
Fig. 9.
Activity and depth of frequency modulation as functions of accuracy demands on stepping. AC: top panels show the mean activity of individual neurons during different ladder tasks expressed as percentages of their activity during simple locomotion. Middle panels show that for the peak activity and bottom panels show changes in the depth of modulation. A: neurons whose activity or depth of modulation increased twice: first, typically during transition from simple to ladder-18 locomotion and then again during transition from ladder-18 to ladder-12. B: neurons whose activity or depth of modulation increased only once, typically during transition from simple to ladder-18 locomotion. C: neurons whose activity or depth of modulation decreased one time, typically during transition from simple to ladder-18 locomotion. D: normalized activity (±SD) of all recorded neurons as a function of normalized cycle time. Asterisk (*) indicates statistical difference between a precise stepping condition and simple walking (P < 0.05, post hoc t-test). For example, 5 symbols over the first time bin show that the activity in all 5 accurate stepping tasks was different from simple walking.

References

    1. Adamovich SV, Berkinblit MB, Fookson O, Poizner H. Pointing in 3D space to remembered targets. I. Kinesthetic versus visual target presentation. J Neurophysiol 79: 2833–2846, 1998 - PubMed
    1. Adamovich SV, Berkinblit MB, Fookson O, Poizner H. Pointing in 3D space to remembered targets. II. Effects of movement speed toward kinesthetically defined targets. Exp Brain Res 125: 200–210, 1999 - PubMed
    1. Amos A, Armstrong DM, Marple-Horvat DE. Changes in the discharge patterns of motor cortical neurons associated with volitional changes in stepping in the cat. Neurosci Lett 109: 107–112, 1990 - PubMed
    1. Armstrong DM, Drew T. Discharges of pyramidal tract and other motor cortical neurones during locomotion in the cat. J Physiol 346: 471–495, 1984 - PMC - PubMed
    1. Bastian AJ, Zackowski KM, Thach WT. Cerebellar ataxia: torque deficiency or torque mismatch between joints? J Neurophysiol 83: 3019–3030, 2000 - PubMed

Publication types

LinkOut - more resources