. 2010 Apr;103(4):2124-38.
doi: 10.1152/jn.00238.2009. Epub 2010 Feb 17.

Roles of narrow- and broad-spiking dorsal premotor area neurons in reach target selection and movement production

Affiliations

Roles of narrow- and broad-spiking dorsal premotor area neurons in reach target selection and movement production

Joo-Hyun Song et al. J Neurophysiol. 2010 Apr.

Abstract

Most visual scenes are complex and crowded, with several different objects competing for attention and action. Thus a complete understanding of the production of goal-directed actions must incorporate the higher-level process of target selection. To examine the neural substrates of target selection for visually guided reaching, we recorded the activity of isolated neurons in the dorsal premotor area (PMd) of monkeys performing a reaction-time visual search task. In this task, monkeys reached to an odd-colored target presented with three distractors. We found that PMd neurons typically discriminate the target before movement onset, ∼150-200 ms after the appearance of the search array. In one subset of neurons, discrimination occurred at a consistent time after search array onset regardless of when the reaching movement occurred, suggesting that these neurons are involved in target selection. In a second group of neurons, discrimination time depended on reach reaction time, consistent with involvement in movement production but not in target selection. To look for physiological corroboration of these two functionally defined groups, we analyzed the extracellular spike waveforms of recorded neurons. This analysis showed a population of neurons with narrow action potentials that carried signals related to target selection. A second population with broader action potentials was more heterogeneous, with some neurons showing activity related to target selection and others showing only movement production activity. These results suggest that PMd contains signals related to target selection and movement execution and that different signals are carried by distinct neural subpopulations.


Figures
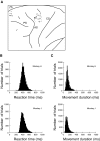
Fig. 1.
Fig. 1.
A: location of electrode penetrations in dorsal premotor area (PMd) of monkey H. The size of the dots represents the number of neurons recorded. CS, central sulcus; AS, arcuate sulcus; PS, principal sulcus. B: histogram of reach reaction times in the search task. C: histogram of reach durations in the search task.
Fig. 2.
Fig. 2.
A: activity of a cell in the single-target delay task. The target is presented in the cell's preferred direction (PD) at time 0, and the solid vertical line indicates the “go” signal. In this and all subsequent figures of this type, each raster represents neural activity in an individual trial, with tick marks indicating action potentials. The mean spike density function is overlaid (σ = 20 ms). Reach onset is indicated in each trial by a thick tick mark. B: activity of the same cell in the visual search task. A target in the cell's PD is presented at time 0, along with distractors at the other 3 locations. C and D: plots of PMd population activity in the single target delay (C) and search (D) tasks, aligned on the onset of the visual stimuli. The ribbons indicate mean activity ±SE. The solid lines represent activity when the target was in the PD, whereas the dotted lines represent activity when the target was in the opposite direction.
Fig. 3.
Fig. 3.
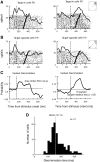
Target/distractor discrimination. In A–C, each column represents results from an individual PMd neuron. The vertical dashed lines show target/distractor discrimination time [the time at which receiver operating characteristic (ROC) area 1st reliably crosses the statistical threshold of P < 0.05]. A: activity of PMd cells aligned on stimulus onset when the target was in the PD. B: activity of the same cells when the target was in the opposite direction. C: ROC analysis of target/distractor discrimination. The thick lines indicate the area under the ROC curve as a function of time from stimulus onset. The thin horizontal lines indicate the P < 0.05 statistical threshold generated at each time point using a permutation test. D: distribution of discrimination times observed in PMd.
Fig. 4.
Fig. 4.
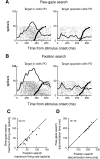
Comparison of PMd activity in free-gaze and fixation search. A: neural activity aligned on stimulus onset in free-gaze search. B: activity of the same cell aligned on stimulus onset in fixation search. In A and B, the left column represents neural activity when the target was in the cell's PD, whereas the right column represents activity when the target was in the opposite direction. C: comparison of maximum firing rates in fixation and free-gaze search. D: comparison of discrimination time in fixation and free-gaze search.
Fig. 5.
Fig. 5.
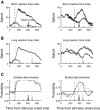
Target/distractor discrimination for the short and long reaction time groups. Neural activity is aligned on the onset of the stimulus array, and each column in the figure shows data from a single neuron. Black corresponds to the short reaction time group and gray corresponds to the long reaction time group. The arrows on the abscissas represent the mean reach reaction time for each group. The vertical dashed lines show discrimination time for the corresponding groups. A: neural activity for the short reaction time group. B: activity of the same cells for the long reaction time group. In A and B, mean ± SE firing rates are plotted. The solid line represents activity when the target was in the cell's PD, and the dotted line represents activity when the target was in the opposite direction. C: ROC analysis of target/distractor discrimination. The thick lines show area under the ROC curve as a function of time from stimulus onset for both short (black) and long (gray) reaction time groups. In the cell on the left, ROC area 1st reliably crosses the threshold at about the same time regardless of reaction time, indicating that discrimination in this neuron is not correlated with reaction time. However, in the cell on the right, discrimination occurs proportionally later for the longer reaction time group.
Fig. 6.
Fig. 6.
Discrimination time vs. reaction time when activity is aligned on stimulus onset. A: predicted relationships of discrimination time and reaction time for short and long RT groups. Dotted line indicates the prediction for neurons involved in target selection, whereas solid line indicates the prediction for neurons involved only in movement production. B: discrimination time in individual PMd neurons as a function of reaction time for short and long reaction time groups. C: histogram of slopes for each cell (the slope of the lines in B).
Fig. 7.
Fig. 7.
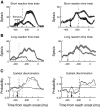
Target/distractor discrimination in the short and long reaction time groups when neural activity is aligned on reach onset. Figure conventions are the same as in Fig. 5 except that neural activity is aligned on reach onset.
Fig. 8.
Fig. 8.
Discrimination time vs. reaction time when activity is aligned on reach onset. Figure conventions are the same as in Fig. 6 except that neural activity is aligned on reach onset.
Fig. 9.
Fig. 9.
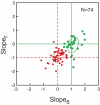
Joint plot of discrimination time/reaction time slopes obtained when the data are aligned on stimulus onset and reach onset. The abscissa indicates the slope obtained from the stimulus-onset alignment (slopes), and the ordinate indicates the slope obtained from the reach-onset alignment (sloper). For a given cell, if the slopes obtained from both alignments are consistent with a discrimination time that is correlated with reaction time, the cell will be plotted near the junction of slopes = 1 and sloper = 0 (solid green circle). On the other hand, if the slopes obtained from both alignments indicate that discrimination time occurs a consistent time after stimulus onset regardless of reaction time, the cell will be plotted near the junction of slopes = 0 and sloper = −1 (dotted red circle). Circles indicate SD around the mean for each category.
Fig. 10.
Fig. 10.
Population activity of target selection and movement production neurons. A: mean ± SE firing rates for cells classified as target selection neurons when the activity is aligned on stimulus onset (left) and reach onset (right). The solid line represents the mean activity when the target was in the PD, whereas the dotted line represents activity when the target was in the opposite direction. B: mean population activity for cells classified as movement production neurons. Conventions are the same as in A.
Fig. 11.
Fig. 11.
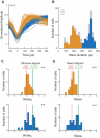
Analysis of extracellular spike widths. A: mean waveforms of all analyzed neurons, aligned relative to their troughs. The heights of the waveforms have been normalized. Waveforms that did not have a biphasic shape with a trough followed by a clear peak were excluded from analysis (n = 18). B: distribution of waveform durations, measured from trough to peak. In A and B, task-related neurons are indicated in orange and blue, for narrow- and broad-spiking units, respectively, whereas non–task-related neurons are indicated in gray. C: histograms of slopes for narrow- (top) and broad-spiking neurons (bottom). D: histograms of sloper for narrow- (top) and broad-spiking neurons (bottom).
Fig. 12.
Fig. 12.
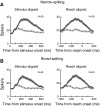
Mean population activity of narrow-spiking neurons (A) and broad-spiking neurons (B). Conventions are the same as in Fig. 10.

Similar articles

Cited by

References

    1. Akaike H. A new look at the statistical model identification. Automatic control. IEEE Transactions on 19: 716–723, 1974
    1. Baldauf D, Cui H, Andersen RA. The posterior parietal cortex encodes in parallel both goals for double-reach sequences. J Neurosci 28: 10081–10089, 2008 - PMC - PubMed
    1. Bartho P, Hirase H, Monconduit L, Zugaro M, Harris KD, Buzsaki G. Characterization of neocortical principal cells and interneurons by network interactions and extracellular features. J Neurophysiol 92: 600–608, 2004 - PubMed
    1. Basso MA, Wurtz RH. Modulation of neuronal activity in superior colliculus by changes in target probability. J Neurosci 18: 7519–7534, 1998 - PMC - PubMed
    1. Batista AP, Santhanam G, Yu BM, Ryu SI, Afshar A, Shenoy KV. Reference frames for reach planning in macaque dorsal premotor cortex. J Neurophysiol 98: 966–983, 2007 - PubMed

Publication types

LinkOut - more resources