. 2010 Mar 9;107(10):4555-60.
doi: 10.1073/pnas.0910333106. Epub 2010 Feb 17.

Atomic details of near-transition state conformers for enzyme phosphoryl transfer revealed by MgF-3 rather than by phosphoranes

Affiliations

Atomic details of near-transition state conformers for enzyme phosphoryl transfer revealed by MgF-3 rather than by phosphoranes

Nicola J Baxter et al. Proc Natl Acad Sci U S A. .

Abstract

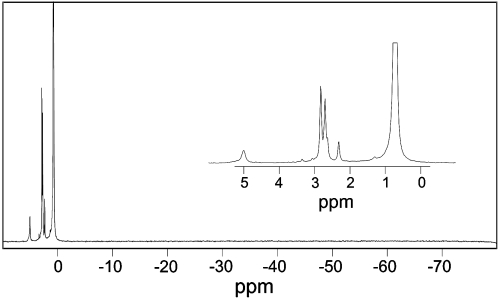
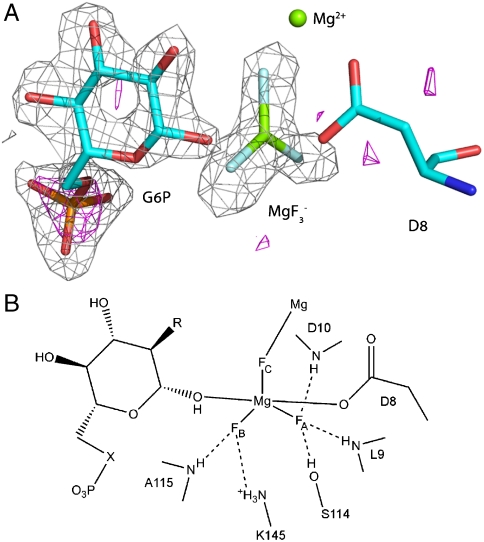
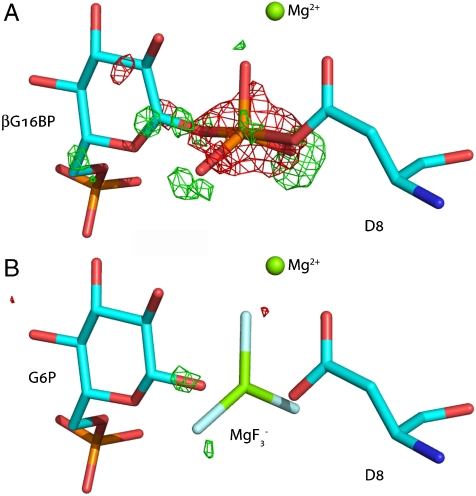
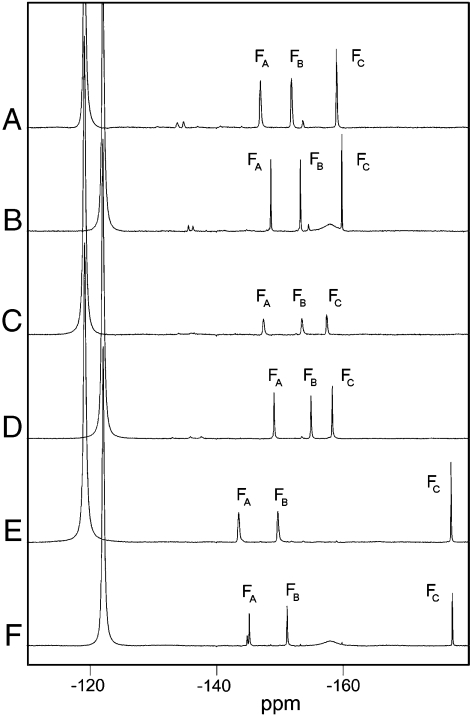
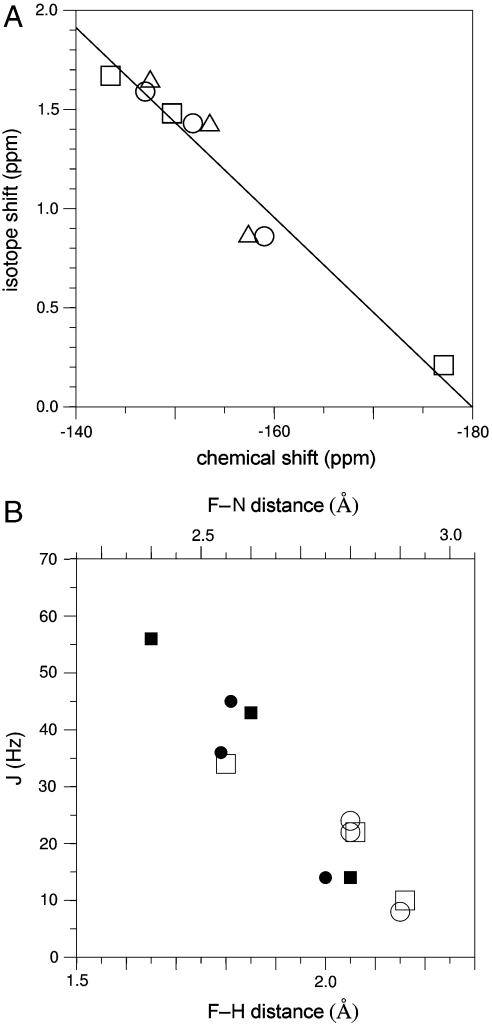
Prior evidence supporting the direct observation of phosphorane intermediates in enzymatic phosphoryl transfer reactions was based on the interpretation of electron density corresponding to trigonal species bridging the donor and acceptor atoms. Close examination of the crystalline state of beta-phosphoglucomutase, the archetypal phosphorane intermediate-containing enzyme, reveals that the trigonal species is not PO-3 , but is MgF-3 (trifluoromagnesate). Although MgF-3 complexes are transition state analogues rather than phosphoryl group transfer reaction intermediates, the presence of fluorine nuclei in near-transition state conformations offers new opportunities to explore the nature of the interactions, in particular the independent measures of local electrostatic and hydrogen-bonding distributions using 19F NMR. Measurements on three beta-PGM-MgF-3 -sugar phosphate complexes show a remarkable relationship between NMR chemical shifts, primary isotope shifts, NOEs, cross hydrogen bond F...H-N scalar couplings, and the atomic positions determined from the high-resolution crystal structure of the beta-PGM-MgF--3 -G6P complex. The measurements provide independent validation of the structural and isoelectronic MgF--3 model of near-transition state conformations.


Conflict of interest statement

The authors declare no conflict of interest.

Figures

Fig. 1.
Fig. 1.
A P31 NMR spectrum of the crystallization components, including β-PGM, G6P, MgCl2 and NH4F. The spectrum shows (expanded in inset) resonances of the protein-bound phosphate from G6P in the PGM-MgF3-G6P-TSA complex (5.00 ppm), free G6P in solution as α- and β-anomers (2.70 and 2.82 ppm, respectively) and free Pi (0.72 ppm), as well as minor amounts of several other non-protein-bound sugar phosphates. No other peaks are observed at chemical shifts resonating upfield of Pi characteristic of a protein-bound aspartyl phosphate or a pentacoordinate phosphorane species.
Fig. 2.
Fig. 2.
Structure of the PGM-MgF3-G6P-TSA complex active site. (A) The difference Fourier map and the anomalous substructure of the PGM-MgF3-G6P-TSA complex. Anomalous difference density contoured at 3σ is shown as a magenta mesh. A large peak (height 7.1σ) is visible for the phosphorus atom in G6P. No corresponding phosphorus peak was observed in the active site confirming the assignment of the trigonal planar species as MgF3- and not PO3-. The difference electron density (Fo-Fc) from the same data is shown as a gray mesh contoured at 3σ for G6P and the MgF3- moiety before their inclusion in the model. (B) Schematic view of the PGM-MgF3-sugar phosphate-TSA complex active site. Three sugar moieties were studied: G6P (R=OH, X=O); 6-deoxy-6-(phosphonomethyl)-D-glucopyranoside (R=OH, X=CH2); 2-deoxy-G6P (R=H, X=O).
Fig. 3.
Fig. 3.
The reported pentacovalent phosphorus intermediate with β-PGM (17) is a PGM-MgF3-G6P-TSA complex. (A) Difference Fourier maps calculated for the structure 1o08 contoured at +3σ and -3σ. The difference maps show significant discrepancies from the original interpretation (17) in the derived bond lengths and assignment of atoms in the TBP moiety. Positive peaks (ca. 8σ, green) are observed beyond each of the equatorial atoms of the TBP indicating that the assigned equatorial bond lengths were too short. The large negative peak (9.6σ, red) for the central coordinating atom indicates that the true atomic species is lighter than phosphorus. (B) Difference Fourier maps calculated after refinement against the deposited structure factors (www.pdb.org) with MgF3- replacing PO3- as the trigonal planar species. Unrestrained refinement of the deposited coordinates against the deposited structure factors leads to equatorial bond lengths of ca. 1.9 Å, which are consistent with our observed bond lengths. Replacing PO3- with MgF3- as the trigonal planar species in the model eliminates peaks in the difference Fourier maps above 3σ.
Fig. 4.
Fig. 4.
F19 NMR spectra of three PGM-MgF3-sugar phosphate-TSA complexes. Spectra were recorded at 25 °C in 50 mM K+ Hepes buffer at pH 7.2, in 100% H2O or in 100% D2O. Chemical shifts are given in ppm for each F19 resonance in the complex. (A) PGM-MgF3-G6P-TSA in 100% H2O buffer (FA=-147.0, FB=-151.8, FC=-159.0). (B) PGM-MgF3-G6P-TSA in 100% D2O buffer (FA=-148.6, FB=-153.3, FC=-159.8). (C) PGM-MgF3-phosphonate-TSA in 100% H2O buffer (FA=-147.5, FB=-153.5, FC=-157.4). (D) PGM-MgF3-phosphonate-TSA in 100% D2O buffer (FA=-149.1, FB=-154.9, FC=-158.3). (E) PGM-MgF3-2deoxyG6P-TSA in 100% H2O buffer (FA=-143.5, FB=-149.7, FC=-177.1). (F) PGM-MgF3-2deoxyG6P-TSA in 100% D2O buffer (FA=-145.2, FB=-151.2, FC=-177.3) and with peak FA showing evidence of residual proton occupancy at one β-PGM hydrogen bond donor site resulting from exchange protection in the D2O buffer. Free F- resonates at -119.0ppm in 100% H2O buffer and at -122.0ppm in 100% D2O buffer.
Fig. 5.
Fig. 5.
Correlation of F19 NMR parameters and their relationships to the crystalline state. (A) Correlation plot showing the relationship between chemical shift (ppm) and isotope shift (δH2O-δD2O, ppm) for the F19 resonances of the PGM-MgF3-G6P-TSA complex (circles), the PGM-MgF3-phosphonate-TSA complex (triangles) and the PGM-MgF3-2deoxyG6P-TSA complex (squares). Linear regression analysis gives R2=0.94. (B) Correlation plot showing the relationships between JHF (filled symbols) and JNF (open symbols) couplings with the corresponding internuclear distances derived from structures of the PGM-MgF3-G6P-TSA (circles) and PGM-AlF4-G6P-TSA (squares) (10) complexes. The F-N distances are derived directly from the experimental coordinates, and the F-H distances are determined to hydrogens positioned using the program XPLOR.

References

    1. Schroeder GK, Lad C, Wyman P, Williams NH, Wolfenden R. The time required for water attack at the phosphorus atom of simple phosphodiesters and of DNA. Proc Natl Acad Sci USA. 2006;103:4052–4055. - PMC - PubMed
    1. Lad C, Williams NH, Wolfenden R. The rate of hydrolysis of phosphomonoester dianions and the exceptional catalytic proficiencies of protein and inositol phosphates. Proc Natl Acad Sci USA. 2003;100:5607–5610. - PMC - PubMed
    1. Friedhoff P, et al. Kinetic analysis of the cleavage of natural and synthetic substrates by the Serratia nuclease. Eur J Biochem. 1996;241:572–580. - PubMed
    1. Stec B, Hehir MJ, Brennan C, Nolte M, Kantrowitz ER. Kinetic and x-ray structural studies of three mutant E. coli alkaline phosphatases: Insights into the catalytic mechanism without the nucleophile Ser102. J Mol Biol. 1998;277:647–662. - PubMed
    1. Harder KW, et al. Characterization and kinetic analysis of the intracellular domain of human protein tyrosine phosphatase beta (HPTP beta) using synthetic phosphopeptides. Biochem J. 1994;298:395–401. - PMC - PubMed

Publication types

MeSH terms

LinkOut - more resources