. 2010 Mar 31;42(3):223-32.
doi: 10.3858/emm.2010.42.3.024.

Suppression of ROS generation by 4,4-diaminodiphenylsulfone in non-phagocytic human diploid fibroblasts

Affiliations

Suppression of ROS generation by 4,4-diaminodiphenylsulfone in non-phagocytic human diploid fibroblasts

Sung Chun Cho et al. Exp Mol Med. .

Abstract

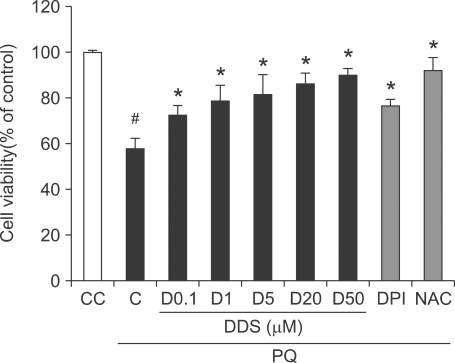
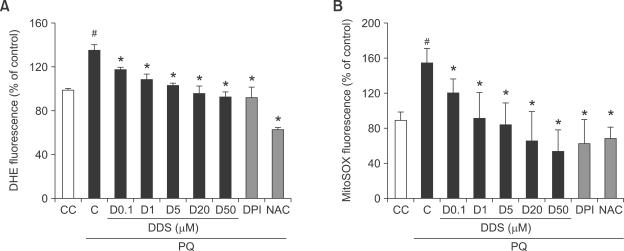
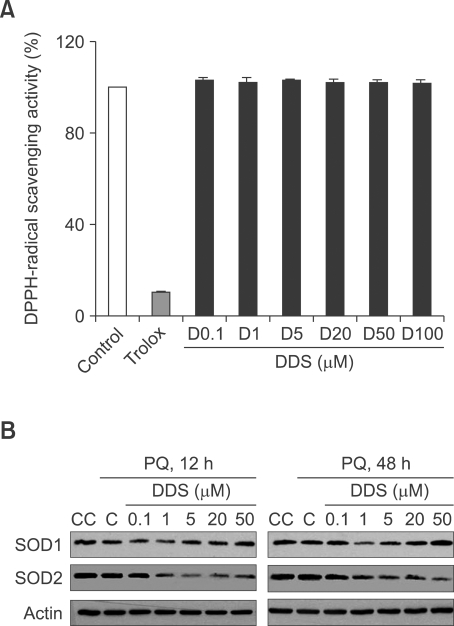
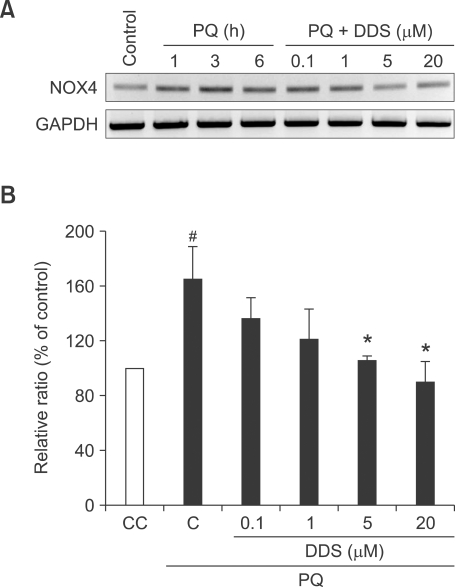
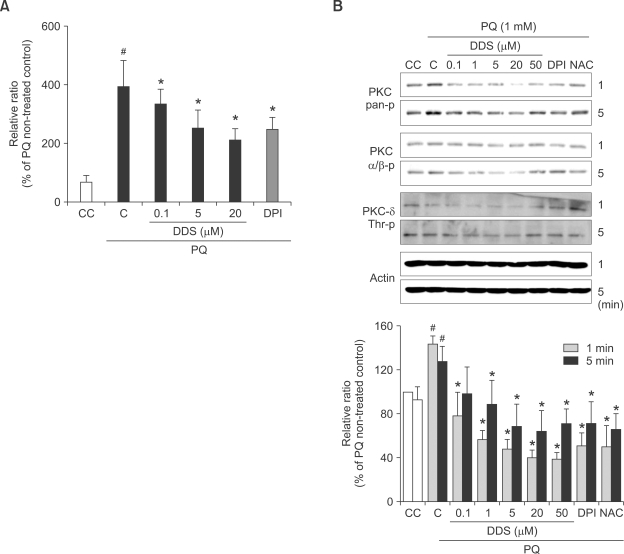
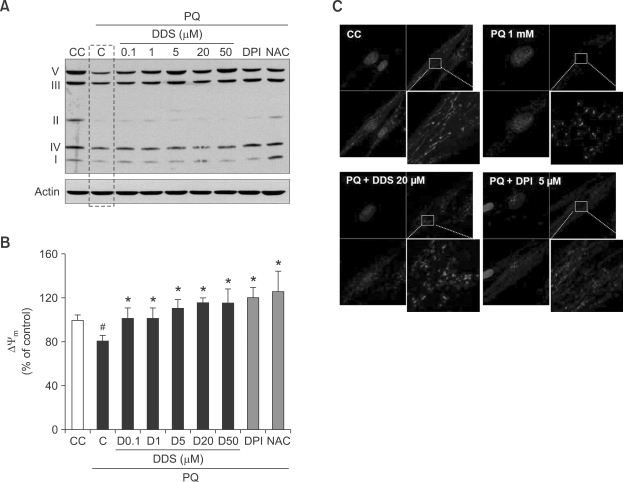
The action mode of 4,4-diaminodiphenylsulfone (DDS) is still under debate, although it has long been used in treatment of several dermatologic diseases including Hansens disease. In this study, we tested the effect of DDS as an antioxidant on paraquat-induced oxidative stress in non-phagocytic human diploid fibroblasts (HDFs). Overall, preincubation of HDFs with DDS prevented the oxidative stress and the resulting cytotoxic damages caused by paraquat in these cells. The specific effects of DDS in paraquat-treated HDFs are summarized as follows: a) reducing the expression of NADPH oxidase 4 (NOX4) by inhibiting paraquat-induced activation of PKC; b) inhibiting paraquat-induced decreases in mitochondrial complex protein levels as well as in membrane potentials; c) consequently, inhibiting the generation of cytosolic and mitochondrial superoxide anions. Taken together, these findings suggest that DDS would suppress the radical generation in non-phagocytic HDFs during oxidative stress, and that DDS might have the extended potential to be used further in prevention of other oxidative stress-related pathologies.


Figures

Figure 1
Figure 1
Effect of DDS on viability of paraquat (PQ) treated HDFs. DDS was added to HDFs, and let stand for 3 h before treatment with 1 mM paraquat. Cell viability was assessed after 48 h with a Cell Counting Kit-8. Positive controls were treated with DPI (5 µM) for 30 min or with NAC (2 mM) for 3 h prior to paraquat exposure. Data are normalized to control and the results are expressed as means ± SE of three experiments. Results expressed as % of control rate. Marks indicate the significant difference, P <0.005 (#, from untreated control cells (CC); *, from only paraquat treated control cells (C)).
Figure 2
Figure 2
Effect of DDS on paraquat (PQ)-induced cytosolic or mitochondrial superoxide anion generation in HDFs. HDFs were seeded to 96 well plate for 24 h and pretreated with various concentration of DDS (0.1, 1, 5, and 20 µM), DPI (5 µM) for 30 min, and NAC (2 mM) for 3 h. The cells were then treated with 1 mM paraquat for 30 min. After paraquat treatment, the cells were incubated with the oxidant-sensitive fluorescent dyes (A) dihydroethidium (DHE) (5 µM, cytosol specific) and (B) MitoSOX Red (5 µM, mitochondria specific), respectively, for 15 min at 37℃. Changes in fluorescence were monitored with a multiwell plate reader using an excitation and emission wavelength of 515 and 590 nm (dihydroethidium), 520 and 580 nm (MitoSOX Red), respectively. Results are expressed as % of control rate. The data shown are representative of six experiments. #P < 0.005 relative to CC, *P < 0.005 relative to C.
Figure 3
Figure 3
Effect of DDS on DPPH-radical scavenging and expression of SOD genes. (A) Radical scavenging activities of DDS in cell-free system (in vitro). The graph is obtained from studies of various concentrations of DDS and Trolox (400 µM) against DPPH (200 µM) radical. (B) Western blot analysis of SOD1 and SOD2 expression in DDS pretreated and paraquat 1 mM treated HDF for 12 h or 48 h.
Figure 4
Figure 4
Effect of DDS on paraquat-induced NOX4 mRNA. (A) HDFs were pre-exposed to different concentrations of DDS for 3 h, after which cells were exposed to 1 mM paraquat for different time periods. NOX4 mRNA levels were determined using a RT-PCR. (B) Results are expressed as % of control rate (paraquat untreated). The data shown are representatives of three experiments from 3 h DDS pretreatment, followed by 3 h paraquat treatment. #P < 0.05 relative to CC, *P < 0.05 relative to C.
Figure 5
Figure 5
Effect of DDS on paraquat (PQ)-induced calcium dependent PKC activation in HDFs. (A) Effect of DDS on paraquat-induced changes in calcium levels in HDFs. HDFs were seeded to 96 well plate for 24 h and pretreated with various concentration of DDS and 5 µM DPI for 30 min. The cells were incubated with the intracellular calcium-indicator Fluo-4 AM at 37℃ for 30 min, and then exposed to 1 mM paraquat for several minutes. The data of 3 min paraquat treatment are representatives of three independent experiments. (B) Paraquat-induced PKC phosphorylation was determined using western blotting. HDFs were first treated with DDS and then exposed to 1 mM paraquat for 1 min or 5 min. PKC phosphorylation was determined using phosphorylation-specific anti-PKC antibody. The data of PKC-pan phosphorylation (specifically serine 660) graphed is representative of three independent experiments. #P < 0.05 relative to CC, *P < 0.05 relative to C.
Figure 6
Figure 6
Effect of DDS on paraquat (PQ)-induced mitochondrial change. (A) HDFs were pretreated with DDS (3 h), DPI (30 min), and NAC (3 h) and then with paraquat 1 mM (24 h). The treated HDFs were harvested for analysis of mitochondrial complex proteins, and immunoblotting with individual antibodies that recognize Complex I (20 kDa ND6 subunit), Complex II (30 kDa FeS, non-heme iron protein, SDHB), Complex III (47kDa core protein 2), Complex IV (18 kDa subunit IV, and Complex V (55 kDa subunit an ATP synthase), as described in the Methods. (B) The change of mitochondrial membrane potential (Δψmm) was examined by DiOC6. DDS, DPI, and NAC pre-treated and then paraquat 1 mM (24 h) treated HDF cells were stained 40 nM DiOC6 for 15 min. The result analyzed by Cary Eclipse fluorescence spectrophotometer (Varian, California) with excitation at 480 nm and emission at 520 nm. (C) Mitochondria morphological change anaylsis used MitoTracker Red and confocal microscopy. HDFs growing on glass coverslips were exposed to paraquat and DDS (or DPI) as described in Methods. Cell cultures were incubated with 1 mM paraquat for 24 h. First, Control HDFs, second, HDFs incubated with only paraquat, third, Cell cultures co-treated with DDS 20 µM and 1 mM paraquat, and last, Cell cultures co-treated with DPI 5 µM and 1 mM paraquat. (A, B, C, and D: ×4,000) Value are means ± SEM (n = 3). #P < 0.005 relative to CC; *P < 0.005 relative to C.

References

    1. Anderson R, Theron AJ, Ras GJ. Regulation by the antioxidants ascorbate, cysteine, and dapsone of the increased extracellular and intracellular generation of reactive oxidants by activated phagocytes from cigarette smokers. Am Rev Respir Dis. 1987;135:1027–1032. - PubMed
    1. Boelsterli UA, Lim PL. Mitochondrial abnormalities--a link to idiosyncratic drug hepatotoxicity? Toxicol Appl Pharmacol. 2007;220:92–107. - PubMed
    1. Boyce ST, Ham RG. Calcium-regulated differentiation of normal human epidermal keratinocytes in chemically defined clonal culture and serum-free serial culture. J Invest Dermatol. 1983;81:33s–40s. - PubMed
    1. Bradshaw TP, McMillan DC, Crouch RK, Jollow DJ. Formation of free radicals and protein mixed disulfides in rat red cells exposed to dapsone hydroxylamine. Free Radic Biol Med. 1997;22:1183–1193. - PubMed
    1. Cocheme HM, Murphy MP. Complex I is the major site of mitochondrial superoxide production by paraquat. J Biol Chem. 2008;283:1786–1798. - PubMed

Publication types

MeSH terms

LinkOut - more resources