Comparative Study

Complete Khoisan and Bantu genomes from southern Africa

Stephan C Schuster et al. Nature. .

Abstract

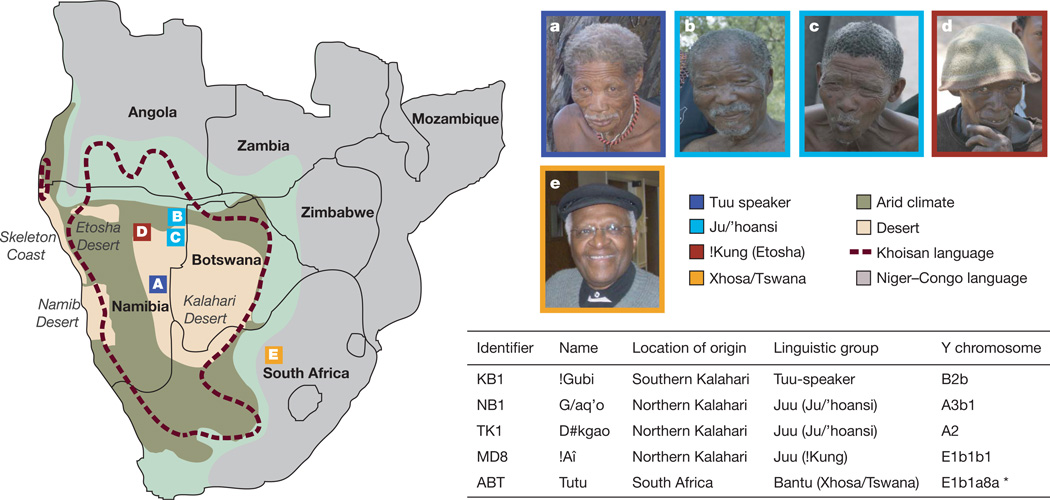
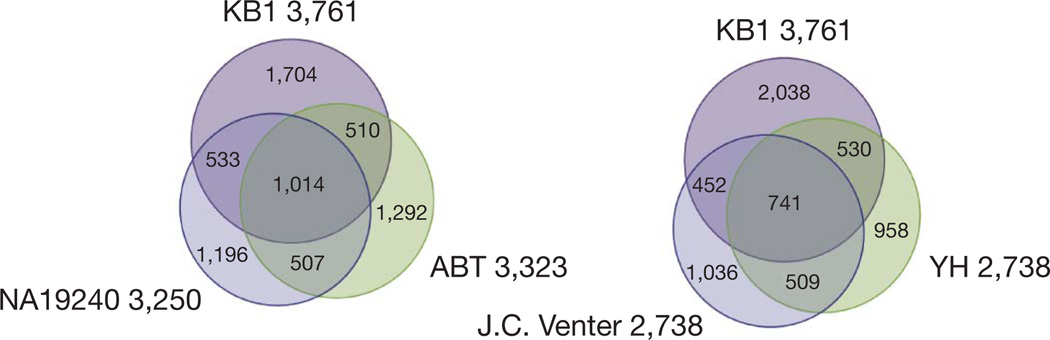
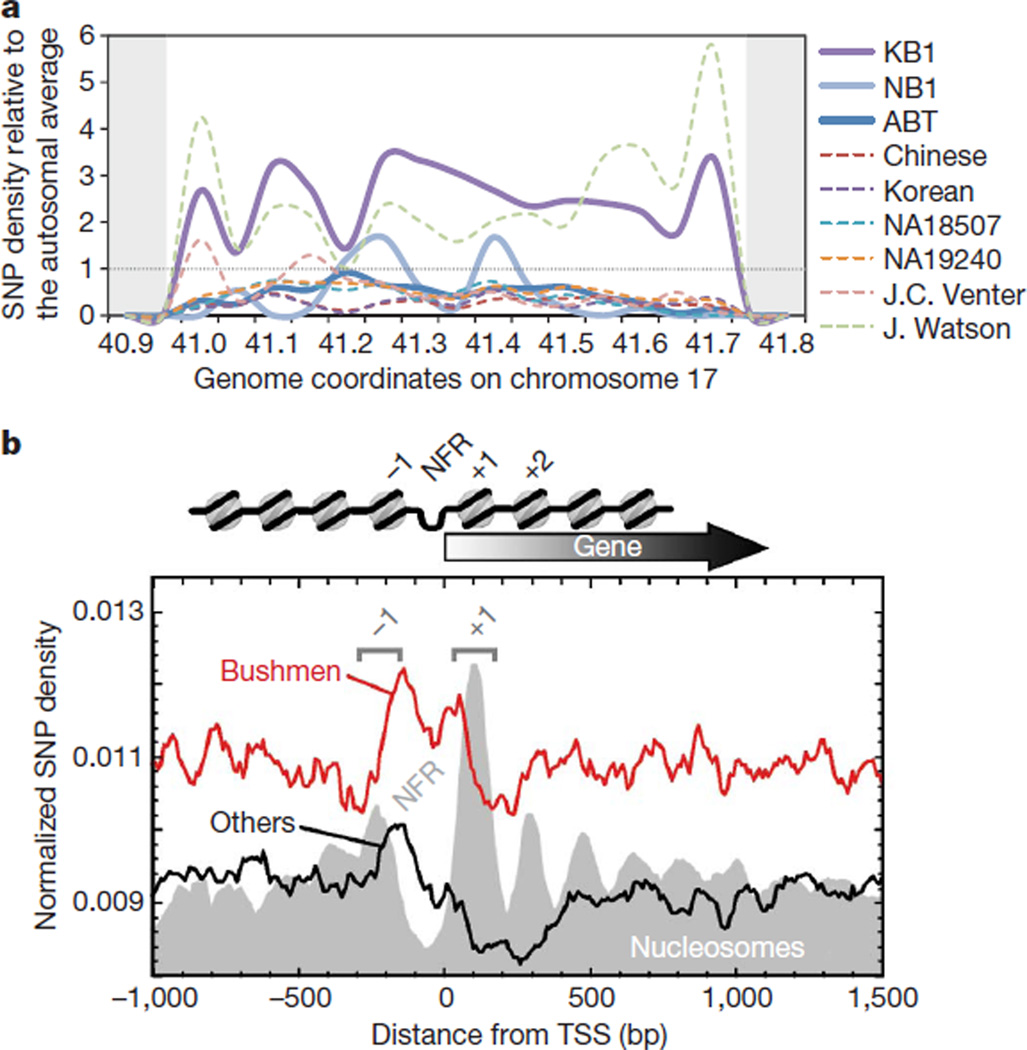
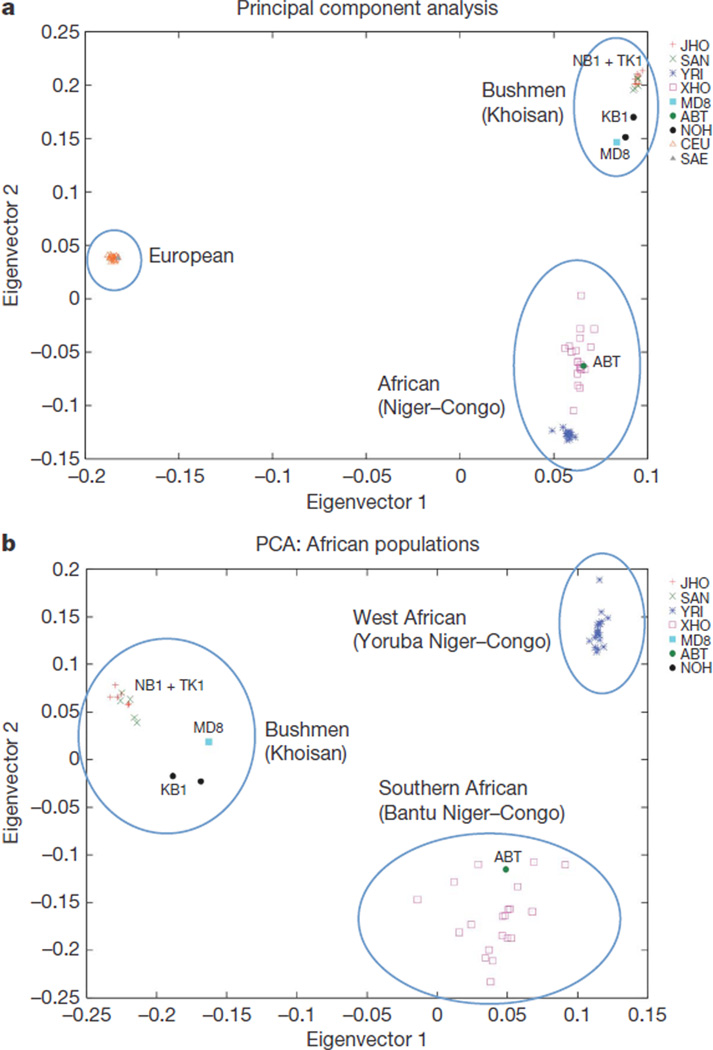
The genetic structure of the indigenous hunter-gatherer peoples of southern Africa, the oldest known lineage of modern human, is important for understanding human diversity. Studies based on mitochondrial and small sets of nuclear markers have shown that these hunter-gatherers, known as Khoisan, San, or Bushmen, are genetically divergent from other humans. However, until now, fully sequenced human genomes have been limited to recently diverged populations. Here we present the complete genome sequences of an indigenous hunter-gatherer from the Kalahari Desert and a Bantu from southern Africa, as well as protein-coding regions from an additional three hunter-gatherers from disparate regions of the Kalahari. We characterize the extent of whole-genome and exome diversity among the five men, reporting 1.3 million novel DNA differences genome-wide, including 13,146 novel amino acid variants. In terms of nucleotide substitutions, the Bushmen seem to be, on average, more different from each other than, for example, a European and an Asian. Observed genomic differences between the hunter-gatherers and others may help to pinpoint genetic adaptations to an agricultural lifestyle. Adding the described variants to current databases will facilitate inclusion of southern Africans in medical research efforts, particularly when family and medical histories can be correlated with genome-wide data.


Figures

Figure 1
Figure 1. Map of southern Africa
The figure shows ethnic grouping and localities of study participants, KB1, NB1, TK1, MD8 and ABT (a–e, respectively), areas of arid and desert climates and the geographic distribution of the Khoisan and Niger–Congo languages. The Khoisan languages are characterized by clicks, denoting additional consonants. The ! is a palatal click; / is a dental click; and # is an alveolar click. Note that the ABT Y chromosome haplogroup was determined using both genotyping and sequencing data generated by this study.
Figure 2
Figure 2. Three-way relationships among SNPs
SNPs from KB1 are compared with those of the Yoruban NA19240 and ABT (left panel), and with an American of European descent (J. C. Venter) and a Chinese individual (YH) (right panel). Numbers are given in thousands. Variant positions that appear in all eight previous genomes were ignored, leading to a slightly smaller number of total SNPs (for example, 3,761,019 differences from the reference assembly for KB1, compared to 4,053,781 if they are included) and fewer SNPs in each three-way intersection. Similar relationships are found when other individuals from the geographical groups are examined.
Figure 3
Figure 3. Variation in SNP densities
a, An SNP hotspot for KB1 and J. Watson on chromosome 17; both individuals are heterozygous for the 17q21.3 H2 haplotype. On either side are repetitive regions where SNPs cannot be called (grey). Local SNP rates are divided by the individual’s autosome-wide rate, so the expected rates are 1.0 (horizontal dotted line). KB1 has a nearly 2.5-fold enrichment of SNPs for 650,000 bases. b, Distribution of SNPs from Bushmen genomes (red line) and non-Bushmen genomes (black line), compared with nucleosome positions (filled grey plot), indicating the nucleosome-free region (NFR) and the −1 and +1 nucleosomes. TSS, transcription start site.
Figure 4
Figure 4. Three-way population structure based on 174,272 autosomal SNPs using PCA
a, b, The PCA of Europeans, Africans (Niger–Congo) and Bushmen (a) and African populations only (b) distinguishes the Bushmen from Yorubans and Bantus. The fraction of the variance explained in a is 0.09 for eigenvector 1 and 0.04 for eigenvector 2, whereas in PCA b it is 0.06 and 0.02, respectively, with a Tracy–Widom P value < 10−12. ABT, sequenced Bantu; CEU, European HapMap; JHO, Juu speakers (including NB1 and TK1); MD8, sequenced !Kung; NOH, Tuu speakers (including KB1); SAE, South African European; SAN, HGDP San; XHO, South African Xhosa; YRI, Yoruba HapMap.

Comment in

References

    1. Gonder MK, et al. Whole-mtDNA genome sequence analysis of ancient African lineages. Mol. Biol. Evol. 2007;24:757–768. - PubMed
    1. Myers S, et al. A fine-scale map of recombination rates and hotspots across the human genome. Science. 2005;310:321–324. - PubMed
    1. Tishkoff SA, et al. The genetic structure and history of Africans and African Americans. Science. 2009;324:1035–1044. - PMC - PubMed
    1. Ahn SM, et al. The first Korean genome sequence and analysis: full genome sequencing for a socio-ethnic group. Genome Res. 2009;19:1622–1629. - PMC - PubMed
    1. Bentley DR, et al. Accurate whole human genome sequencing using reversible terminator chemistry. Nature. 2008;456:53–59. - PMC - PubMed

Publication types

Associated data