. 2010 Feb 18;463(7283):963-7.
doi: 10.1038/nature08746.

TCR-peptide-MHC interactions in situ show accelerated kinetics and increased affinity

Affiliations

TCR-peptide-MHC interactions in situ show accelerated kinetics and increased affinity

Johannes B Huppa et al. Nature. .

Abstract

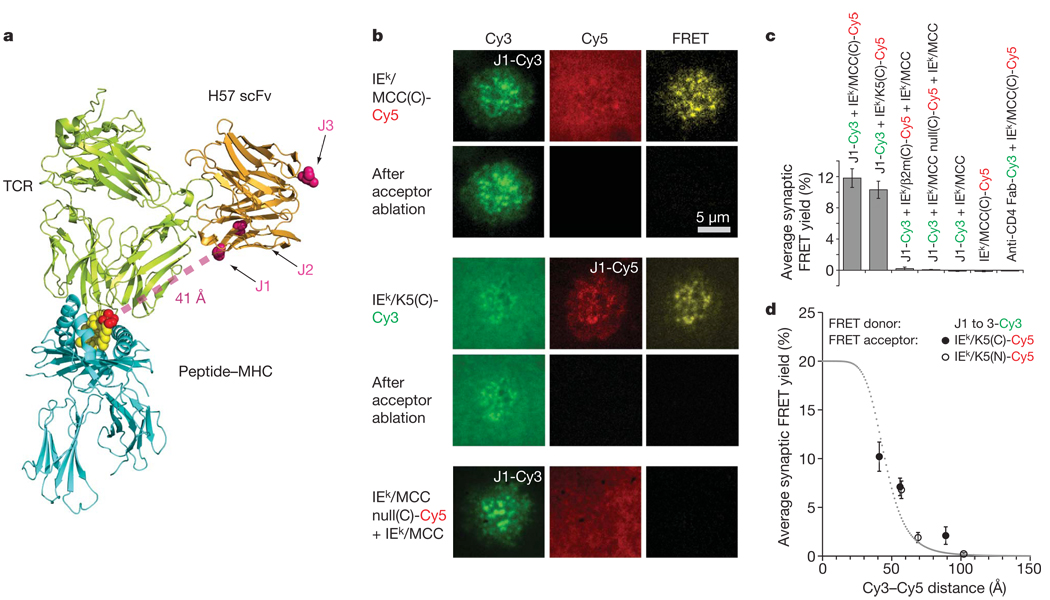
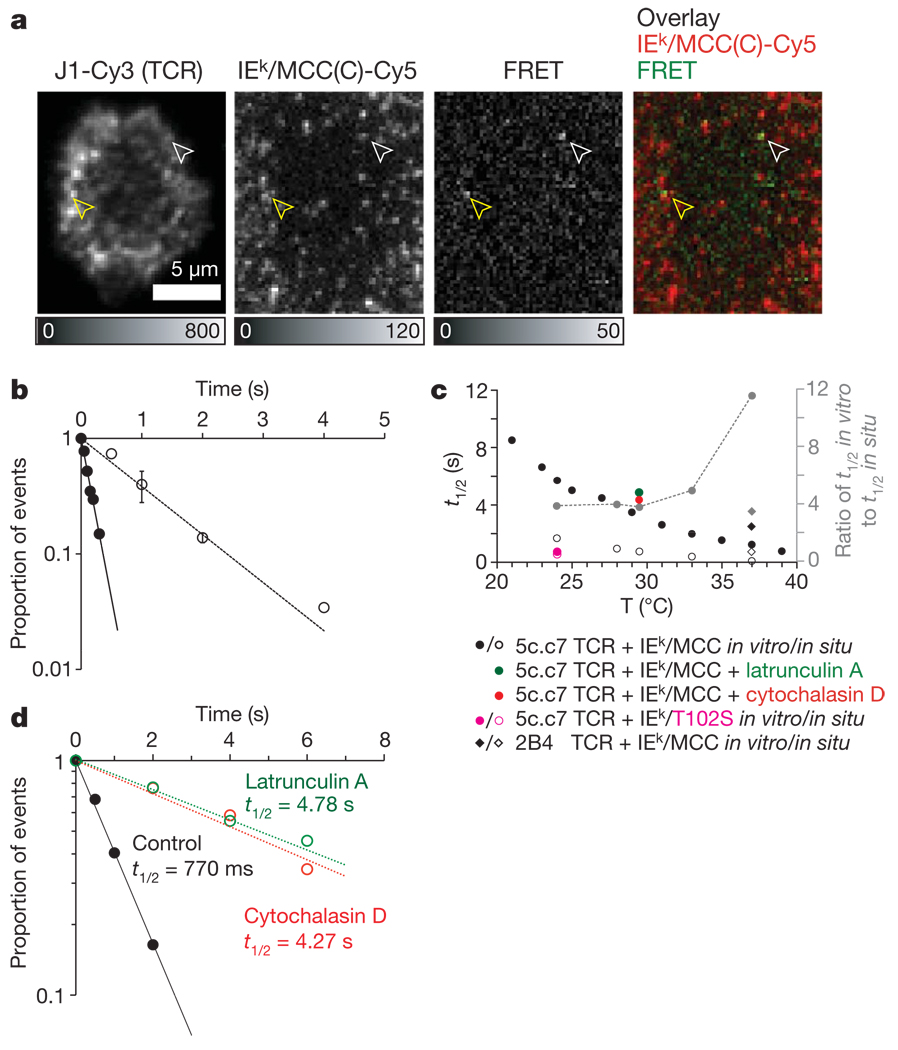
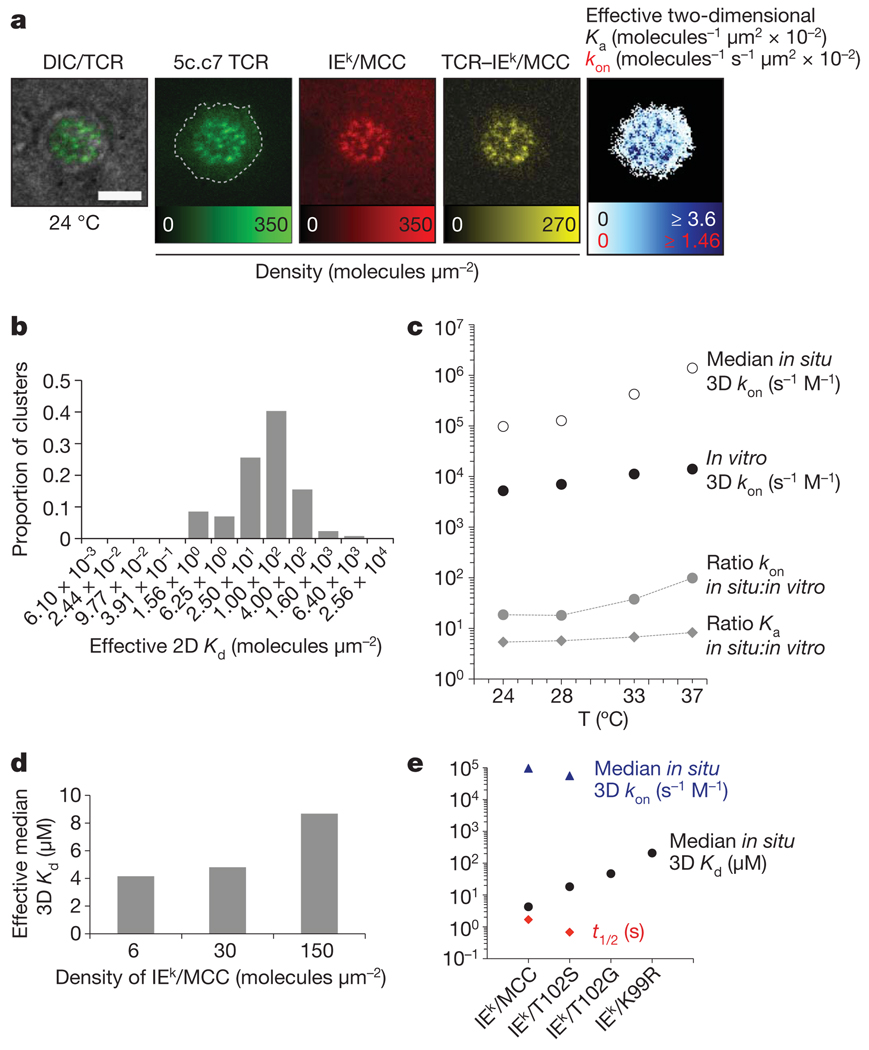
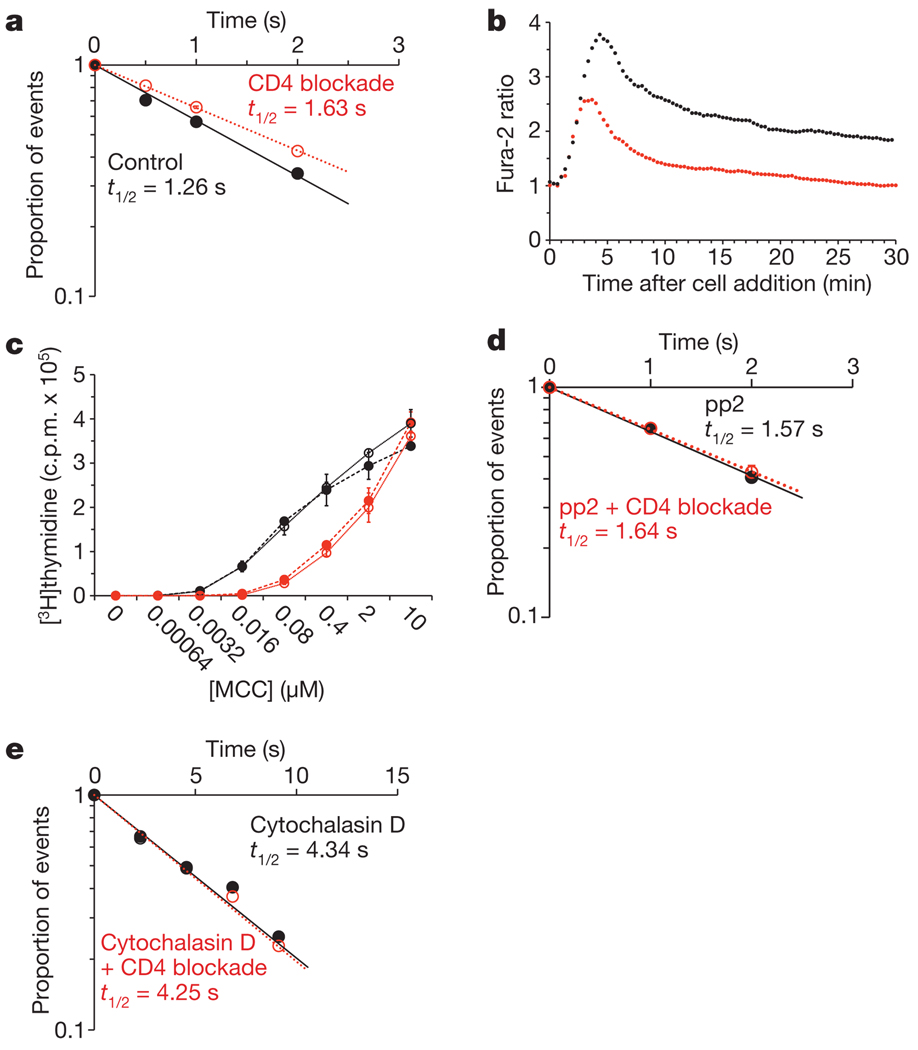
The recognition of foreign antigens by T lymphocytes is essential to most adaptive immune responses. It is driven by specific T-cell antigen receptors (TCRs) binding to antigenic peptide-major histocompatibility complex (pMHC) molecules on other cells. If productive, these interactions promote the formation of an immunological synapse. Here we show that synaptic TCR-pMHC binding dynamics differ significantly from TCR-pMHC binding in solution. We used single-molecule microscopy and fluorescence resonance energy transfer (FRET) between fluorescently tagged TCRs and their cognate pMHC ligands to measure the kinetics of TCR-pMHC binding in situ. When compared with solution measurements, the dissociation of this complex was increased significantly (4-12-fold). Disruption of actin polymers reversed this effect, indicating that cytoskeletal dynamics destabilize this interaction directly or indirectly. Nevertheless, TCR affinity for pMHC was significantly elevated as the result of a large (about 100-fold) increase in the association rate, a likely consequence of complementary molecular orientation and clustering. In helper T cells, the CD4 molecule has been proposed to bind cooperatively with the TCR to the same pMHC complex. However, CD4 blockade had no effect on the synaptic TCR affinity, nor did it destabilize TCR-pMHC complexes, indicating that the TCR binds pMHC independently of CD4.


Figures

Figure 1
Figure 1. FRET as a sensor for TCR–ligand interactions
a, Composite model based on the TCR–pMHC and TCR–H57 Fab structures. J1–J3 indicate dye attachment sites. b, Cy3, Cy5 and corrected FRET channels before and after acceptor bleaching at 24 °C. Scale bar, 5 µm. c, d, FRET yields determined through donor recovery after receptor bleaching. Error bars represent s.e.m. (n ≥ 40; temperature 24 °C, ρ(IEk/peptide-Cy5) = 120 µm−2). c, Ligand specificity of the FRET yield. d, Relationship between Cy3 (FRET donor)–Cy5 (FRET acceptor) distance and FRET yield. Cy3–Cy5 distances were estimated from a, excluding the length of the linker and dye. The dotted line in d equals theoretical synaptic FRET yield (R0 = 4.6 nm) with a maximum (roughly 20%) predicted from experiments shown in Supplementary Fig. 23b.
Figure 2
Figure 2. Synaptic off-rates measured through smFRET
a, High-abundance FRET donor J1-Cy3, single molecule IEk/MCC(C)-Cy5 (acceptor), smFRET channel and overlaid single-molecule channels are indicated. The white arrows indicate a single FRET event co-localizing with a single FRET acceptor, and the yellow arrows a candidate event co-localizing with several FRET acceptors. The intensity bars show counts per pixel. Scale bar, 5 µm. b, Decay plot of interactions between synaptic TCR (J1-Cy3) and IEk/MCC(C)-Cy5 at 37 °C. Open circles, 2B4 TCR (t1/2 = 723 ms); filled circles, 5c.c7 TCR (t1/2 = 109 ms). Error bars represent the standard deviation of the mean of the values as determined with different acquisition delays (for example 500, 1,000 and 2000 ms). c, Temperature spectrum of measured t1/2 values of interactions between 5c.c7 and IEk/MCC and between 2B4 TCR and IEk/MCC (in vitro:in situ t1/2 ratios are shown in grey). d, Interactions between 5c.c7 TCR and IEk/MCC at 29.5 °C are prolonged on disruption of cortical actin through cytochalasin D and latrunculin A.
Figure 3
Figure 3. Quantitative image analysis yields effective synaptic 2D Kd, 2D Ka and 2D kon
a, Synaptic density plots of TCR, IEk/MCC and TCR–IEk/MCC result in a 2D Ka plot (white print) and 2D kon plot (red print). Dashed line, synapse boundary. Scale bar, 5 µm. b, 2D Kd distribution was measured for 5c.c7 TCR–IEk/MCC microclusters at 37 °C. Values on the x axis show the upper interval boundary. The median value is 38.8. c, 3D kon values were determined in 5c.c7 TCR–IEk/MCC microclusters and by SPR. In situ:in vitro kon ratios and in vitro:in situ Kd ratios are shown. d, 3D Kd values are shown for 5c.c7 TCR microclusters interacting at 37 °C with bilayers containing IEk/MCC(C)-Cy5 at the indicated densities. e, 3D Kd, 3D kon and t1/2 values were measured at 24 °C in 5c.c7 TCR microclusters in contact with the indicated ligands.
Figure 4
Figure 4. Effect of CD4 on TCR signalling and ligand binding
a, Decay of interactions between synaptic 5c.c7 TCR and IEk/MCC at 28 °C in the absence (black) and presence (red) of CD4 antibody blockade. b, Calcium signalling at 28 °C in the absence (black) and presence (red) of CD4 antibody blockade. c, T-cell proliferation (as measured by [3H]thymidine incorporation into naive T cells in response to varying doses of antigenic peptide) in the absence (black) and presence (red) of CD4 antibody blockade. Open symbols, with H57 scFv; filled symbols, without H57 scFv. Error bars represent the standard deviation of the mean for data sets measured in triplicate. d, CD4 blockade did not affect the synaptic t1/2 of the 5c.c7 TCR–IEk/MCC complex at 28 °C after inhibition of the activity of p56lck with pp2. e, CD4 blockade did not affect the synaptic t1/2 of the 5c.c7 TCR–IEk/MCC complex at 29.5 °C after disruption of the actin cortex with cytochalasin D.

Similar articles

Cited by

References

    1. Davis MM, et al. T cells as a self-referential, sensory organ. Annu. Rev. Immunol. 2007;25:681–695. - PubMed
    1. Grakoui A, et al. The immunological synapse: a molecular machine controlling cell activation. Science. 1999;285:221–227. - PubMed
    1. Monks CR, Freiberg BA, Kupfer H, Sciaky N, Kupfer A. Three-dimensional segregation of supramolecular activation clusters in T cells. Nature. 1998;395:82–86. - PubMed
    1. Corr M, et al. T cell receptor-MHC class I peptide interactions: affinity, kinetics, and specificity. Science. 1994;265:946–949. - PubMed
    1. Matsui K, Boniface JJ, Steffner P, Reay PA, Davis MM. Kinetics of T-cell receptor binding to peptide/I-Ek complexes: correlation of the dissociation rate with T-cell responsiveness. Proc. Natl Acad. Sci. USA. 1994;91:12862–12866. - PMC - PubMed

Publication types

MeSH terms