

An integrated approach to cause-of-death analysis: cause-deleted life tables and decompositions of life expectancy
- PMID: 20165568
- PMCID: PMC2822405
- DOI: 10.4054/DemRes.2008.19.35
An integrated approach to cause-of-death analysis: cause-deleted life tables and decompositions of life expectancy
Abstract
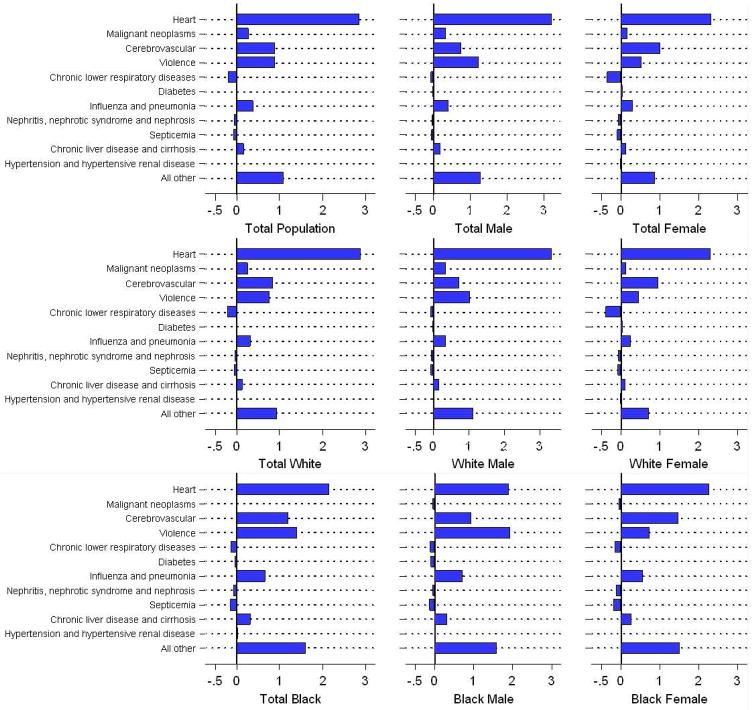
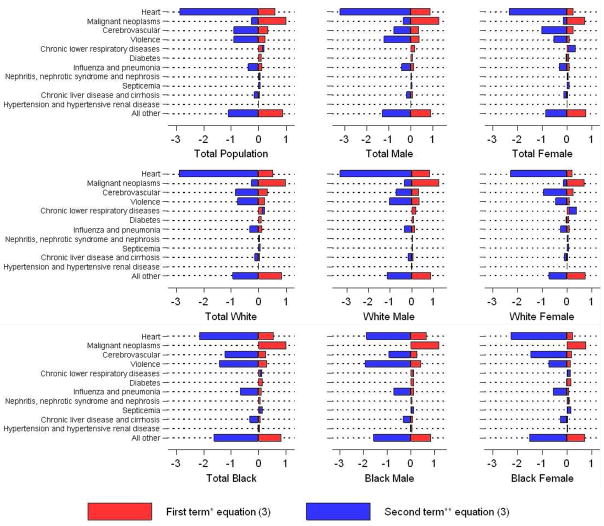
This article integrates two methods that analyze the implications of various causes of death for life expectancy. One of the methods attributes changes in life expectancy to various causes of death; the other method examines the effect of removing deaths from a particular cause on life expectancy. This integration is accomplished by new formulas that make clearer the interactions among causes of death in determining life expectancy. We apply our approach to changes in life expectancy in the United States between 1970 and 2000. We demonstrate, and explain analytically, the paradox that cancer is responsible for more years of life lost in 2000 than in 1970 despite the fact that declines in cancer mortality contributed to advances in life expectancy between 1970 and 2000.
Figures
References
-
- Andreev E. Metod komponent v analize prodoljitelnosty zjizni. [The method of components in the analysis of length of life] Vestnik Statistiki. 1982;9:42–47.
-
- Andreev E, Shkolnikov VM, Begun AZ. Algorithm for decomposition of differences between aggregate demographic measures and its application to life expectancies, healthy life expectancies, parity progression ratios and total fertility rates. Demographic Research. 2002;7(14):499–522.
-
- Arias E. United States Life Tables, 2000. Hyattsville, MD: National Center for Health Statistics; 2002. - PubMed
-
- Arriaga E. Mortality in South and East Asia: A Review of Changing Trends and Patterns, Manila 1980, WHO/ESCAP. Geneva: World Health Organization; 1982. A note on the use of temporary life expectancies for analyzing changes and differentials of mortality; pp. 559–562.
-
- Arriaga E. Measuring and explaining the change in life expectancies. Demography. 1984;21(1):83–96. - PubMed
Grants and funding
LinkOut - more resources
Full Text Sources