. 2010 Jun;11(2):203-22.
doi: 10.1007/s10162-009-0206-7. Epub 2010 Feb 18.

Supporting cell division is not required for regeneration of auditory hair cells after ototoxic injury in vitro

Affiliations

Supporting cell division is not required for regeneration of auditory hair cells after ototoxic injury in vitro

Jialin Shang et al. J Assoc Res Otolaryngol. 2010 Jun.

Abstract

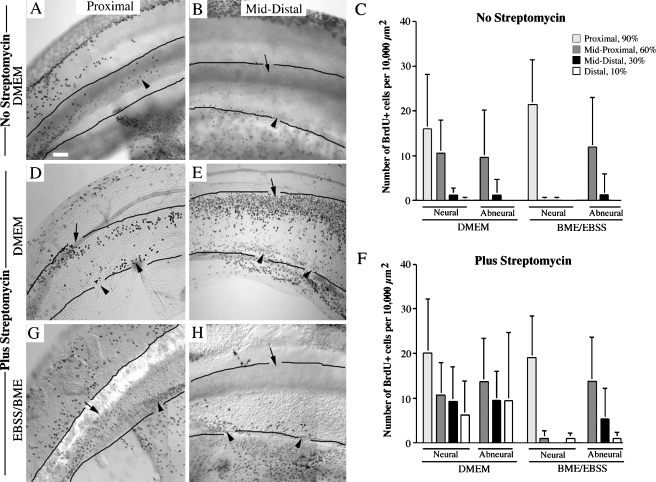
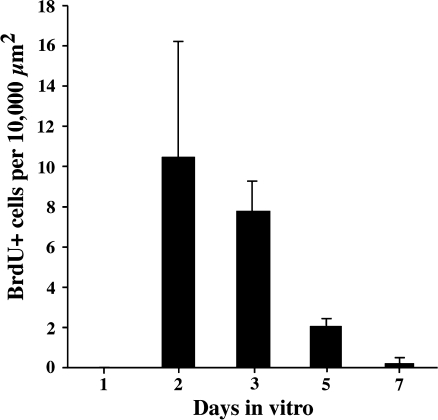
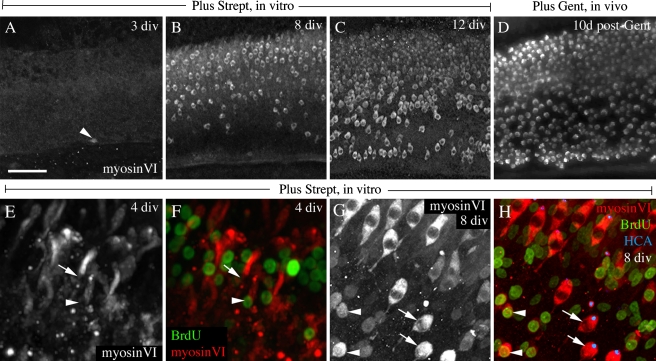
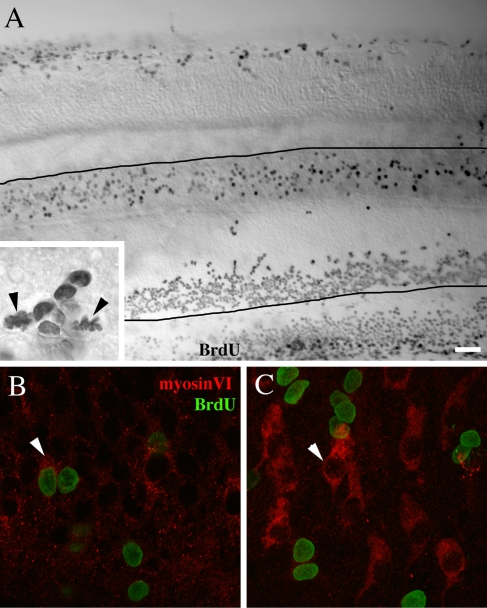
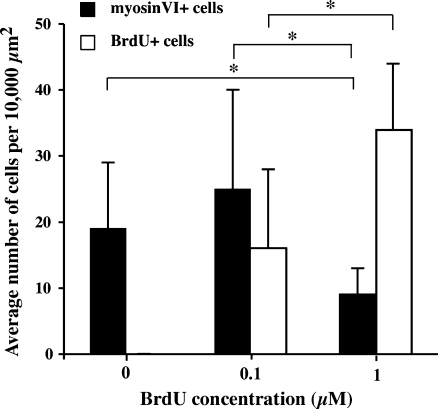
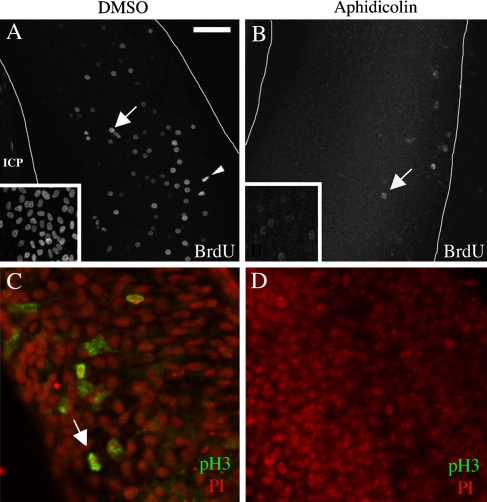
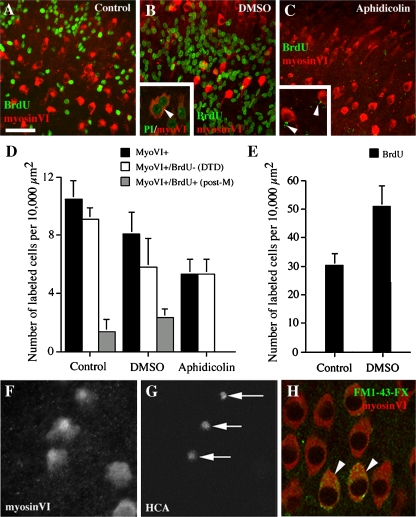
In chickens, nonsensory supporting cells divide and regenerate auditory hair cells after injury. Anatomical evidence suggests that supporting cells can also transdifferentiate into hair cells without dividing. In this study, we characterized an organ culture model to study auditory hair cell regeneration, and we used these cultures to test if direct transdifferentiation alone can lead to significant hair cell regeneration. Control cultures (organs from posthatch chickens maintained without streptomycin) showed complete hair cell loss in the proximal (high-frequency) region by 5 days. In contrast, a 2-day treatment with streptomycin induced loss of hair cells from all regions by 3 days. Hair cell regeneration proceeded in culture, with the time course of supporting cell division and hair cell differentiation generally resembling in vivo patterns. The degree of supporting cell division depended upon the presence of streptomycin, the epithelial region, the type of culture media, and serum concentration. On average, 87% of the regenerated hair cells lacked the cell division marker BrdU despite its continuous presence, suggesting that most hair cells were regenerated via direct transdifferentiation. Addition of the DNA polymerase inhibitor aphidicolin to culture media prevented supporting cell division, but numerous hair cells were regenerated nonetheless. These hair cells showed signs of functional maturation, including stereociliary bundles and rapid uptake of FM1-43. These observations demonstrate that direct transdifferentiation is a significant mechanism of hair cell regeneration in the chicken auditory after streptomycin damage in vitro.


Figures

FIG. 1
FIG. 1
Sampling methods used for quantitative analyses. These drawings depict the regions analyzed for quantitative examination of BrdU and myosinVI labeling densities. A Sampling method used for counts of BrdU labeling graphed in Figures 5 and 6 and presented in Tables 2 and 3. B Sampling method used for counts of myosinVI and BrdU labeling (discussed in text with Fig. 7 and graphed in Fig. 11). C Sampling method used for counts of myosinVI and BrdU labeling graphed in Figure 9. D Sampling method for counts of propidium-iodide-positive nuclei, discussed in the text after Figure 11.
FIG. 2
FIG. 2
Spontaneous and streptomycin-induced loss of stereociliary bundles in culture. This figure shows fluorescence images of rhodamine phalloidin labeling taken from three regions of the BP (proximal A, D, G, J, M; middle B, E, H, K, N; and distal C, F, I, L, O). Control BPs (not cultured) are shown in AC. Also shown are BPs cultured in DMEM plus 10% FBS, without streptomycin (Strept) for 2 (DF) or 5 days in vitro (div; GI), and BPs cultured in DMEM plus 10% FBS with 78 µM streptomycin for 2 div (JL) or with 78 µM streptomycin for 2 days (d) followed by 1 day without streptomycin (MO). Note the complete loss of rhodamine phalloidin-labeled bundles in cultures lacking streptomycin from the proximal BP by 5 div (G) and the complete loss of bundles in cultures containing streptomycin from all regions of the BP by 3 div (MO). In all images, proximal is toward the left and abneural (AN) is down. Scale bar in A = 50 µm for all panels.
FIG. 3
FIG. 3
Quantitative analysis of stereociliary bundle loss in culture. Average densities of HC bundles are graphed for control (uncultured) BPs (A), BPs cultured for 1 day with no streptomycin in DMEM or BME/EBSS (B), BPs cultured for 1 day plus streptomycin in DMEM or BME/EBSS (C), BPs cultured for 2 days with no streptomycin in DMEM or BME/EBSS (D), and BPs cultured for 2 days plus streptomycin in DMEM or BME/EBSS (E). Four different regions were analyzed for these counts: proximal (90% distance from distal tip), midproximal (60% distance from distal tip), middistal (30% distance from distal tip), and distal (10% distance from distal tip). Asterisks indicate significant difference from corresponding region in control (A) at p ≤ 0.05, as assessed by ANOVA with Fisher PLSD. Error bars represent SD.
FIG. 4
FIG. 4
Streptomycin treatment in culture causes loss of all hair cells from the epithelium. Panels AD show images of myosinVI labeling in control BPs (not cultured, A, C) and in BPs cultured for 2 days in DMEM with 10% FBS with 78 µM streptomycin followed by 1 day in the same media without streptomycin (B, D). Images were taken midway between the proximal and distal tips of the BP in whole-mount preparations (A, B) and plastic cross sections (C, D). Note the virtually complete loss of myosin VI immunoreactivity from this region in streptomycin-treated BPs (B, D). One remaining myosinVI-positive cell is evident in B (arrow), and a single myosinVI-positive cell in the process of extrusion is shown in D (arrow). Panels EH show images of FM1-43-FX incorporation in the control BP (E), in a BP cultured for 2 days without streptomycin (F), and in a BP cultured for 2 days plus streptomycin (G, H). Whole mounts from the middistal region are shown. The plane of focus is in the HC layer (HCL) in EG and in the SC layer (SCL) in H. Note the retention of FM1-43-FX-positive HC after 2 days of culture in streptomycin-free conditions (F) compared to the complete loss of FM1-43-FX-positive HCs after 2 days of culture with streptomycin (G). FM1-43-FX-positive cells were not present in the SCL in either culture condition (H). AN abneural; Lu lumen. Scale bar in A = 50 µm for A and B and 20 µm for CH.
FIG. 5
FIG. 5
Supporting cells divide in cultures with and without streptomycin. Digital images (A, B, D, E, G, H) show BrdU immunohistochemistry in different regions of the whole-mount BP after three continuous days of culture in DMEM/10% FBS or BME/EBSS/10% FBS, with or without streptomycin (at 78 µM) and with BrdU (1 µM) in the media. All images are focused on the sensory epithelium. The black lines demarcate the neural and abneural limits of the BP. In cultures maintained without streptomycin (A, B), several BrdU-positive nuclei (black dots) were present in the proximal end of the BP (A), but fewer BrdU-positive nuclei were present in the distal half (B). Average BrdU labeling densities for cultures grown without streptomycin in either DMEM or BME/EBSS (10% FBS) are graphed in C (see Fig. 1A for sampling methods and Table 1 for Ns). Error bars represent SD. In cultures maintained in DMEM (D, E) or BME/EBSS (G, H) plus 78 µM streptomycin and 10% FBS, significantly more BrdU-positive nuclei were noted than in controls, particularly in middle and distal regions. BrdU labeling densities for streptomycin-treated cultures are graphed in F. Error bars represent SD. In all images, proximal is toward the left, and abneural is down. Arrows point to the neural region of the BP, and arrowheads point to the abneural region. Scale bar in A = in 50 µm for A, B, D, E, G, and H.
FIG. 6
FIG. 6
Time course of supporting cell division after streptomycin treatment. Graph shows average overall BrdU labeling densities in whole-mounted cultures that were maintained in DMEM plus 10% FBS for different times after treatment with 78 µM streptomycin. Sampling methods are depicted in Figure 1A. Error bars represent SD. ANOVAs showed that densities at 2 and 3 days were significantly different (p < 0.05) from all of the other times, but they were not different from each other. Also, average densities in cultures at 1, 5, and 7 days were not statistically different from each other (≥0.05).
FIG. 7
FIG. 7
Hair cells are regenerated in culture. Panels AC show myosinVI immunolabeling in the midproximal region of whole-mount BPs that were cultured in DMEM and 1% FBS for 2 days with 78 µM streptomycin (Strept) followed by periods in the same media without streptomycin, for a total of 3 days (A), 8 days (B), or 12 days (C) in vitro. The arrow in A indicates an original HC that remained in the epithelium after streptomycin treatment. Panel D shows myosinVI labeling in a similar region at 10 days after gentamicin (Gent) treatment in vivo. In AD, proximal is toward the left, and abneural is downward. Panels E and F are images taken from one field located in the middle of a BP after 4 days of culture (including an initial 2 days of streptomycin). MyosinVI labeling is shown in E, and both myosinVI (cytoplasmic label) and BrdU (nuclear label) labeling are shown in F. The nuclei of two regenerated HCs are indicated by an arrow and an arrowhead in each panel. In both cells, long myosinVI-positive necks extend upward, toward the lumen. The arrow points to a cell that has a BrdU-negative nucleus; the arrowhead points to a cell with a BrdU-positive nucleus. Panels G and H are images taken from one field in the middle of the BP after 8 days of culture, with myosinVI labeling in G and with myosinVI (cytoplasmic label) and BrdU (nuclear label) labeling shown in H. Arrowheads point to myosinVI-positive cells that are BrdU-positive, while arrows point to myosinVI-positive cells that are BrdU-negative and also have HCA-positive bundles (small dots) atop them. Scale bar in A = 50 µm for AD and 15 µm for EH.
FIG. 8
FIG. 8
Supporting cell division and hair cell differentiation proceed in serum-free conditions. All panels show BPs cultured in serum-free DMEM and 1 µM BrdU for the whole culture period. A This panel shows BrdU labeling in the middle region of a BP cultured for 3 days with 78 µM streptomycin prior to fixation. Distal is toward the right, and abneural is downward. The edges of the BP are demarcated by black lines. In the inset, BrdU-positive cells are shown at higher magnification, including two mitotic figures (arrows). B, C MyosinVI and BrdU labeling in a BP cultured for 2 days with 78 µM streptomycin followed by 4 days without streptomycin. Arrowhead in B points to a cell that is myosinVI positive and BrdU positive; arrowhead in C points to a cell that is myosinVI positive and BrdU negative. Scale bar in A = 30 µm for A, 5 µm for inset in A and for B and C.
FIG. 9
FIG. 9
BrdU inhibits differentiation of hair cells. The average density of BrdU-positive cells (white bars) or myosinVI-positive cells (black bars) is shown for 8-day cultures grown in DMEM plus 1% FBS for 2 days with 78 µM streptomycin followed by 6 days in the same media without streptomycin, with different concentrations of BrdU present. The sampling method for these counts is depicted in Figure 1C. Asterisks signify significant differences between indicated groups (p ≤ 0.05, ANOVA with Fisher’s PLSD). Error bars represent SD.
FIG. 10
FIG. 10
Aphidicolin prevents supporting cell division. All panels show whole-mounted BPs cultured for 3 days in DMEM plus 1% FBS and 78 µM streptomycin, supplemented with either 1% DMSO (A, C) or 25 µM aphidicolin (B, D). Thin white lines in A and B show the neural and abneural borders of the BP (neural is toward the right). The midproximal region is shown in all panels. In A, a portion of the inferior cartilage plate (ICP) covers the abneural edge of the BP. A DMSO controls had numerous BrdU-positive cells in the BP and the middle of the ICP (inset). BrdU labeling in interphase nuclei (arrow) and in mitotic chromatin (arrowhead) was evident. B Aphidicolin-treated BPs showed dramatic reduction in the number of BrdU-positive cells and the intensity of BrdU labeling, in both the BP (arrow) and the ICP (inset). DMSO-treated BPs had numerous pH3-positive mitotic figures (C), while aphidicolin-treated BPs (D) had none. Propidium iodide (PI) labeling (nuclear label in C and D) indicates location of all nuclei. Scale bar in A = 30 µm for A and B (and insets) and 15 µm for C and D.
FIG. 11
FIG. 11
Regeneration of differentiated hair cells proceeds when supporting cell division is blocked. AC show BPs cultured for 8 days (2 days plus 78 µM streptomycin followed by 6 days without streptomycin) in control media (DMEM/1% FBS; A), media plus 1% DMSO (B), or media plus 25 µM aphidicolin (C). BPs were immunolabeled for myosinVI (cytoplasmic label) and BrdU (nuclear label). The arrowhead in Binset points to two fused myosinVI-positive cells with propidium-iodide (PI)-labeled nuclei. The inset in C shows BrdU-positive cell fragments (arrowheads). Average labeling densities for myosinVI-positive cells for each treatment group cultures are graphed in D. MyoVI myosinVI, DTD direct transdifferentiation, Post-M postmitotic. Average labeling densities for BrdU-positive cells for each treatment group are graphed in E. The sampling method for counts in D and E is depicted in Figure 1B. Error bars in both graphs represent SD. F and G show the same field from a 10-day culture, double-labeled for myosinVI and HCA. Arrows in G point to HCA-positive stereociliary bundles atop myosinVI-positive cells in F. H shows a 12-day culture double-labeled for myosinVI (label throughout cytoplasm) and FM1-43-FX (punctate label in cytoplasm). Arrowheads point to two double-labeled cells. Scale bar in A = 25 µm for AC, 15 µm for B and C insets, and 10 µm for FH.

Similar articles

Cited by

References

    1. Adler HJ, Raphael Y. New hair cells arise from supporting cell conversion in the acoustically damaged chick inner ear. Neurosci Lett. 1996;205:17–20. doi: 10.1016/0304-3940(96)12367-3. - DOI - PubMed
    1. Adler HJ, Komeda M, Raphael Y. Further evidence for supporting cell conversion in the damaged avian basilar papilla. Int J Dev Neurosci. 1997;15:375–385. doi: 10.1016/S0736-5748(96)00098-6. - DOI - PubMed
    1. Baird RA, Steyger PS, Schuff N. Mitotic and nonmitotic hair cell regeneration in the bullfrog vestibular otolith organs. Ann N Y Acad Sci. 1996;781:59–70. doi: 10.1111/j.1749-6632.1996.tb15693.x. - DOI - PubMed
    1. Baird RA, Burton MD, Fashena DS, Naeger RA. Hair cell recovery in mitotically blocked cultures of the bullfrog saccule. Proc Natl Acad Sci USA. 2000;97:11722–11729. doi: 10.1073/pnas.97.22.11722. - DOI - PMC - PubMed
    1. Bartolami S, Goodyear R, Richardson G. Appearance and distribution of the 275 kD hair-cell antigen during development of the avian inner ear. J Comp Neurol. 1991;314:777–788. doi: 10.1002/cne.903140410. - DOI - PubMed

Publication types

MeSH terms

LinkOut - more resources