Snail transcription factor regulates neuroendocrine differentiation in LNCaP prostate cancer cells
- PMID: 20166136
- PMCID: PMC2877267
- DOI: 10.1002/pros.21132
Snail transcription factor regulates neuroendocrine differentiation in LNCaP prostate cancer cells
Abstract
Background: Snail transcription factor induces epithelial-mesenchymal transition (EMT) via decreased cell adhesion-associated molecules like E-cadherin, and increased mesenchymal markers like vimentin. We previously established Snail-mediated EMT model utilizing androgen-dependent LNCaP cells. These cells express increased vimentin protein and relocalization of E-cadherin from the cell membrane to the cytosol. Interestingly, Snail transfection in LNCaP cells resulted in cells acquiring a neuroendocrine (NE)-like morphology with long neurite-like processes.
Methods: We tested for expression of NE markers neuron-specific enolase (NSE) and chromogranin A (CgA) by Western blot analysis, and performed proliferation assays to test for paracrine cell proliferation.
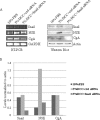
Results: LNCaP cells transfected with Snail displayed increase in the NE markers, NSE and CgA as well as translocation of androgen receptor (AR) to the nucleus. LNCaP C-33 cells that have been previously published as a neuroendocrine differentiation (NED) model exhibited increased expression levels of Snail protein as compared to LNCaP parental cells. Functionally, conditioned medium from the LNCaP-Snail transfected cells increased proliferation of parental LNCaP and PC-3 cells, which could be abrogated by NSE/CgA siRNA. Additionally, NED in LNCaP-C33 cells or that induced in parental LNCaP cells by serum starvation could be inhibited by knockdown of Snail with siRNA.
Conclusion: Overall our data provide evidence that Snail transcription factor may promote tumor aggressiveness in the LNCaP cells through multiple processes; induction of EMT may be required to promote migration, while NED may promote tumor proliferation by a paracrine mechanism. Therefore, therapeutic targeting of Snail may prove beneficial in not only abrogating EMT but also NED.
Figures


Similar articles
-
Receptor protein tyrosine phosphatase alpha signaling is involved in androgen depletion-induced neuroendocrine differentiation of androgen-sensitive LNCaP human prostate cancer cells.Oncogene. 2003 Oct 2;22(43):6704-16. doi: 10.1038/sj.onc.1206764. Oncogene. 2003. PMID: 14555984
-
Androgen deprivation induces human prostate epithelial neuroendocrine differentiation of androgen-sensitive LNCaP cells.Endocr Relat Cancer. 2006 Mar;13(1):151-67. doi: 10.1677/erc.1.01043. Endocr Relat Cancer. 2006. PMID: 16601285
-
Interleukin-6 induces neuroendocrine differentiation (NED) through suppression of RE-1 silencing transcription factor (REST).Prostate. 2014 Aug;74(11):1086-94. doi: 10.1002/pros.22819. Epub 2014 May 12. Prostate. 2014. PMID: 24819501
-
Interleukin-6 undergoes transition from growth inhibitor associated with neuroendocrine differentiation to stimulator accompanied by androgen receptor activation during LNCaP prostate cancer cell progression.Prostate. 2007 May 15;67(7):764-73. doi: 10.1002/pros.20553. Prostate. 2007. PMID: 17373716
-
Interleukin-6 regulates androgen receptor activity and prostate cancer cell growth.Mol Cell Endocrinol. 2002 Nov 29;197(1-2):231-8. doi: 10.1016/s0303-7207(02)00263-0. Mol Cell Endocrinol. 2002. PMID: 12431817 Review.
Cited by
-
Constitutively active androgen receptor variants upregulate expression of mesenchymal markers in prostate cancer cells.PLoS One. 2013 May 2;8(5):e63466. doi: 10.1371/journal.pone.0063466. Print 2013. PLoS One. 2013. PMID: 23658830 Free PMC article.
-
Prognostic value of circulating Chromogranin A in prostate cancer: a systematic review and meta-analysis.Front Oncol. 2025 Feb 5;15:1521558. doi: 10.3389/fonc.2025.1521558. eCollection 2025. Front Oncol. 2025. PMID: 39975592 Free PMC article. Review.
-
Characterization of Epithelial-Mesenchymal and Neuroendocrine Differentiation States in Pancreatic and Small Cell Ovarian Tumor Cells and Their Modulation by TGF-β1 and BMP-7.Cells. 2024 Dec 5;13(23):2010. doi: 10.3390/cells13232010. Cells. 2024. PMID: 39682758 Free PMC article.
-
β-Adrenergic Receptor Signaling in Prostate Cancer.Front Oncol. 2015 Jan 12;4:375. doi: 10.3389/fonc.2014.00375. eCollection 2014. Front Oncol. 2015. PMID: 25629002 Free PMC article. Review.
-
The role of phenotypic plasticity in the escape of cancer cells from targeted therapy.Biochem Pharmacol. 2016 Dec 15;122:1-9. doi: 10.1016/j.bcp.2016.06.014. Epub 2016 Jun 25. Biochem Pharmacol. 2016. PMID: 27349985 Free PMC article. Review.
References
-
- Bubendorf L, Schopfer A, Wagner U, Sauter G, Moch H, Willi N, Gasser TC, Mihatsch MJ. Metastatic patterns of prostate cancer: an autopsy study of 1,589 patients. Hum Pathol. 2000;31(5):578–583. - PubMed
-
- Cher ML. Mechanisms governing bone metastasis in prostate cancer. Curr Opin Urol. 2001;11(5):483–488. - PubMed
-
- Roudier MP, Corey E, True LD, Hiagno CS, Ott SM, Vessell RL. Histological, immunophenotypic and histomorphometric characterization of prostate cancer bone metastases. Cancer Treat Res. 2004;118:311–339. - PubMed
-
- Hay ED. An overview of epithelio-mesenchymal transformation. Acta Anat (Basel) 1995;154(1):8–20. - PubMed
-
- Bellovin DI, Bates RC, Muzikansky A, Rimm DL, Mercurio AM. Altered localization of p120 catenin during epithelial to mesenchymal transition of colon carcinoma is prognostic for aggressive disease. Cancer Res. 2005;65(23):10938–10945. - PubMed
Publication types
MeSH terms
Substances
Grants and funding
LinkOut - more resources
Full Text Sources
Research Materials

