

Direct interaction of the mouse cytomegalovirus m152/gp40 immunoevasin with RAE-1 isoforms
- PMID: 20166740
- PMCID: PMC2840211
- DOI: 10.1021/bi902130j
Direct interaction of the mouse cytomegalovirus m152/gp40 immunoevasin with RAE-1 isoforms
Abstract
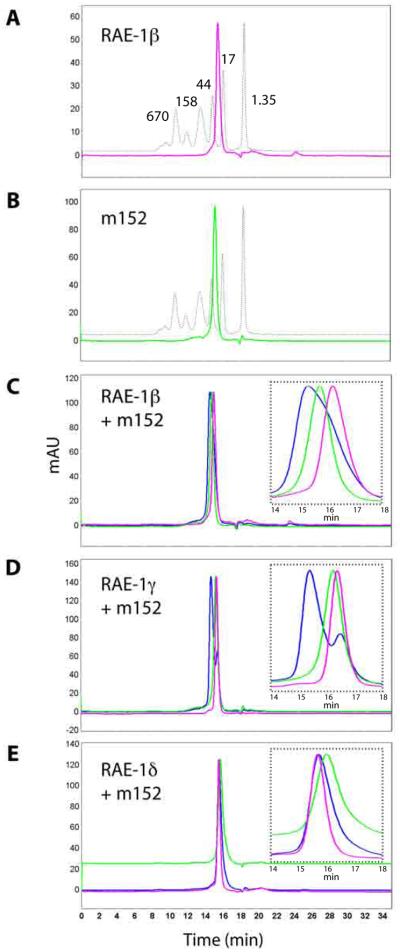
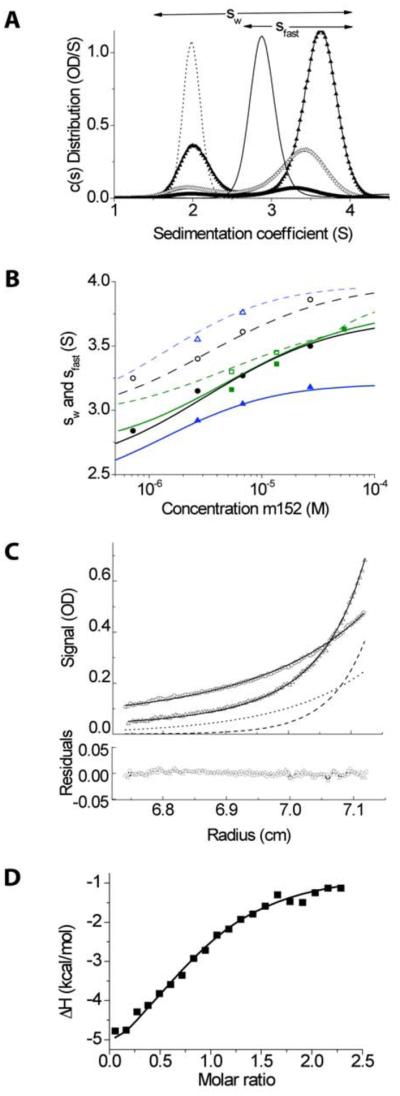
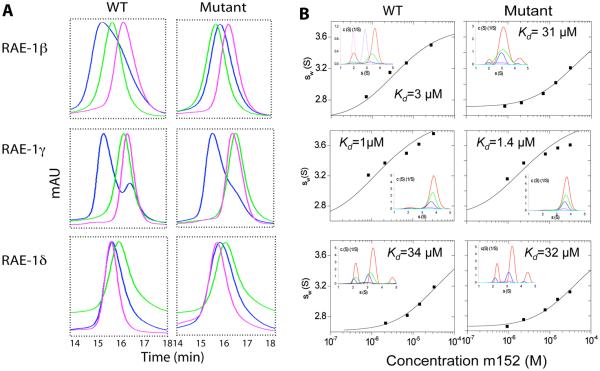
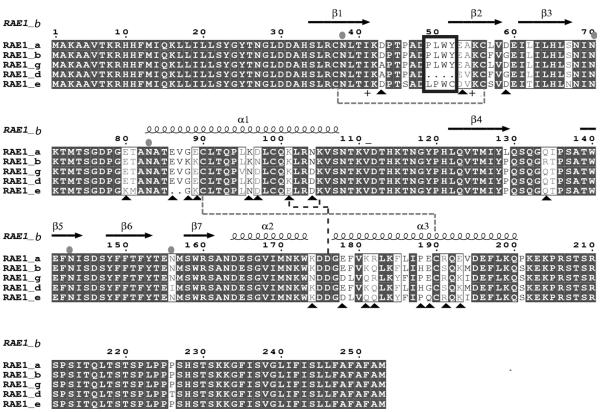
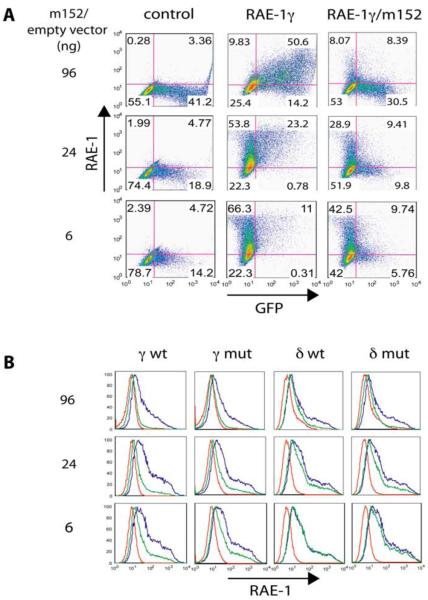
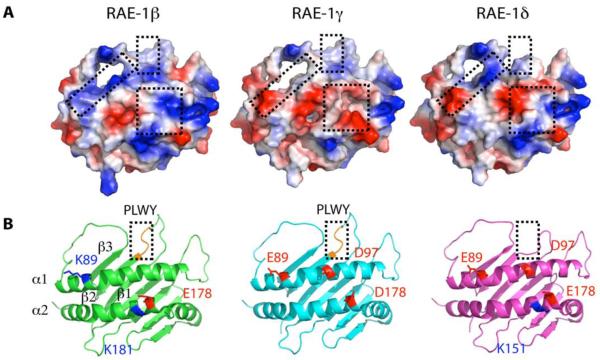
Cytomegaloviruses (CMVs) are ubiquitous species-specific viruses that establish acute, persistent, and latent infections. Both human and mouse CMVs encode proteins that inhibit the activation of natural killer (NK) cells by downregulating cellular ligands for the NK cell activating receptor, NKG2D. The MCMV glycoprotein m152/gp40 downregulates the surface expression of RAE-1 to prevent NK cell control in vivo. So far, it is unclear if there is a direct interaction between m152 and RAE-1 and, if so, if m152 interacts differentially with the five identified RAE-1 isoforms, which are expressed as two groups in MCMV-susceptible or -resistant mouse strains. To address these questions, we expressed and purified the extracellular domains of RAE-1 and m152 and performed size exclusion chromatography binding assays as well as analytical ultracentrifugation and isothermal titration calorimetry to characterize these interactions quantitatively. We further evaluated the role of full-length and naturally glycosylated m152 and RAE-1 in cotransfected HEK293T cells. Our results confirmed that m152 binds RAE-1 directly, relatively tightly (K(d) < 5 microM), and with 1:1 stoichiometry. The binding is quantitatively different depending on particular RAE-1 isoforms, corresponding to the susceptibility to downregulation by m152. A PLWY motif found in RAE-1beta, although contributing to its affinity for m152, does not influence the affinity of RAE-1gamma or RAE-1delta, suggesting that other differences contribute to the RAE-1-m152 interaction. Molecular modeling of the different RAE-1 isoforms suggests a potential site for the m152 interaction.
Figures
Similar articles
-
Differential susceptibility of RAE-1 isoforms to mouse cytomegalovirus.J Virol. 2009 Aug;83(16):8198-207. doi: 10.1128/JVI.02549-08. Epub 2009 Jun 3. J Virol. 2009. PMID: 19494006 Free PMC article.
-
The murine cytomegalovirus immunoevasin gp40/m152 inhibits NKG2D receptor RAE-1γ by intracellular retention and cell surface masking.J Cell Sci. 2021 Jun 1;134(11):jcs257428. doi: 10.1242/jcs.257428. Epub 2021 Jun 4. J Cell Sci. 2021. PMID: 34085696
-
The role of NKG2D signaling in inhibition of cytotoxic T-lymphocyte lysis by the Murine cytomegalovirus immunoevasin m152/gp40.J Virol. 2007 Nov;81(22):12564-71. doi: 10.1128/JVI.01328-07. Epub 2007 Sep 12. J Virol. 2007. PMID: 17855532 Free PMC article.
-
Cytomegaloviral control of MHC class I function in the mouse.Immunol Rev. 1999 Apr;168:167-76. doi: 10.1111/j.1600-065x.1999.tb01291.x. Immunol Rev. 1999. PMID: 10399073 Review.
-
Murine cytomegalovirus regulation of NKG2D ligands.Med Microbiol Immunol. 2008 Jun;197(2):159-66. doi: 10.1007/s00430-008-0080-7. Epub 2008 Feb 8. Med Microbiol Immunol. 2008. PMID: 18259774 Review.
Cited by
-
Direct antigen presentation is the canonical pathway of cytomegalovirus CD8 T-cell priming regulated by balanced immune evasion ensuring a strong antiviral response.Front Immunol. 2023 Dec 12;14:1272166. doi: 10.3389/fimmu.2023.1272166. eCollection 2023. Front Immunol. 2023. PMID: 38149242 Free PMC article.
-
Global multi-method analysis of affinities and cooperativity in complex systems of macromolecular interactions.Anal Chem. 2012 Nov 6;84(21):9513-9. doi: 10.1021/ac302357w. Epub 2012 Oct 16. Anal Chem. 2012. PMID: 23020071 Free PMC article.
-
Overview of current methods in sedimentation velocity and sedimentation equilibrium analytical ultracentrifugation.Curr Protoc Protein Sci. 2013 Feb;Chapter 20:Unit20.12. doi: 10.1002/0471140864.ps2012s71. Curr Protoc Protein Sci. 2013. PMID: 23377850 Free PMC article.
-
The NKG2D ligands RAE-1δ and RAE-1ε differ with respect to their receptor affinity, expression profiles and transcriptional regulation.PLoS One. 2010 Oct 19;5(10):e13466. doi: 10.1371/journal.pone.0013466. PLoS One. 2010. PMID: 20976056 Free PMC article.
-
The p36 isoform of murine cytomegalovirus m152 protein suffices for mediating innate and adaptive immune evasion.Viruses. 2013 Dec 16;5(12):3171-91. doi: 10.3390/v5123171. Viruses. 2013. PMID: 24351798 Free PMC article.
References
-
- Lenac T, Arapovic J, Traven L, Krmpotic A, Jonjic S. Med Microbiol Immunol. 2008;197:159–166. - PubMed
-
- Powers C, DeFilippis V, Malouli D, Fruh K. Cytomegalovirus immune evasion. Curr Top Microbiol Immunol. 2008;325:333–359. - PubMed
-
- French AR, Yokoyama WM. Natural killer cells and viral infections. Curr Opin Immunol. 2003;15:45–51. - PubMed
-
- Doom CM, Hill AB. MHC class I immune evasion in MCMV infection. Med Microbiol Immunol. 2008;197:191–204. - PubMed
Publication types
MeSH terms
Substances
Grants and funding
LinkOut - more resources
Full Text Sources
Molecular Biology Databases
