

Pentosan polysulfate promotes proliferation and chondrogenic differentiation of adult human bone marrow-derived mesenchymal precursor cells
- PMID: 20167057
- PMCID: PMC2875662
- DOI: 10.1186/ar2935
Pentosan polysulfate promotes proliferation and chondrogenic differentiation of adult human bone marrow-derived mesenchymal precursor cells
Abstract
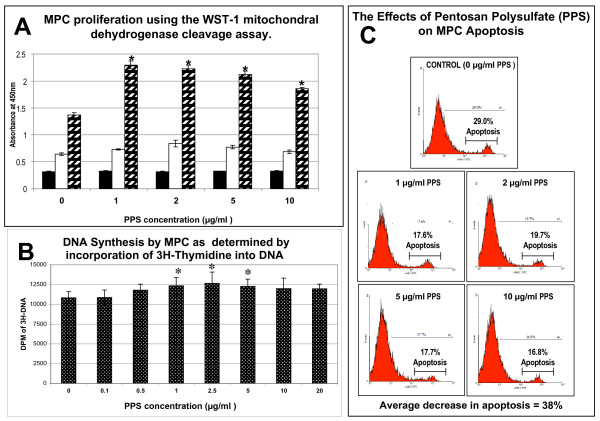
Introduction: This study was undertaken to determine whether the anti-osteoarthritis drug pentosan polysulfate (PPS) influenced mesenchymal precursor cell (MPC) proliferation and differentiation.
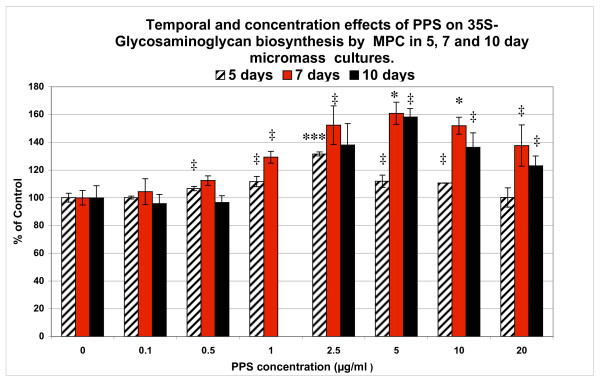
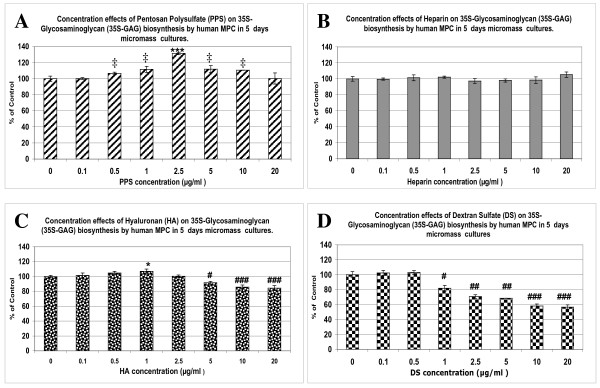
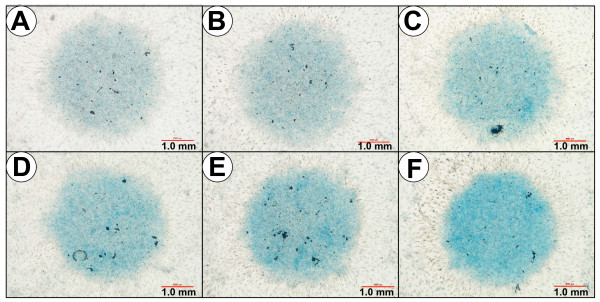
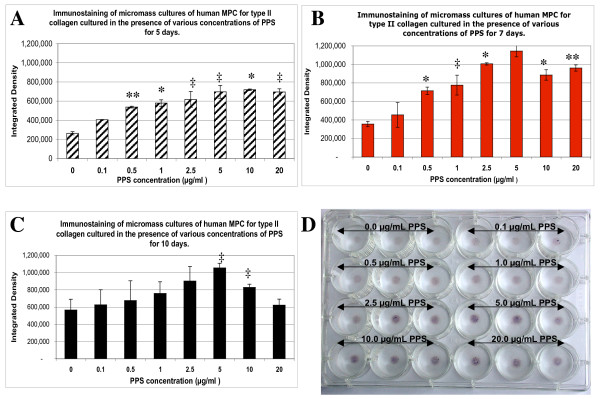
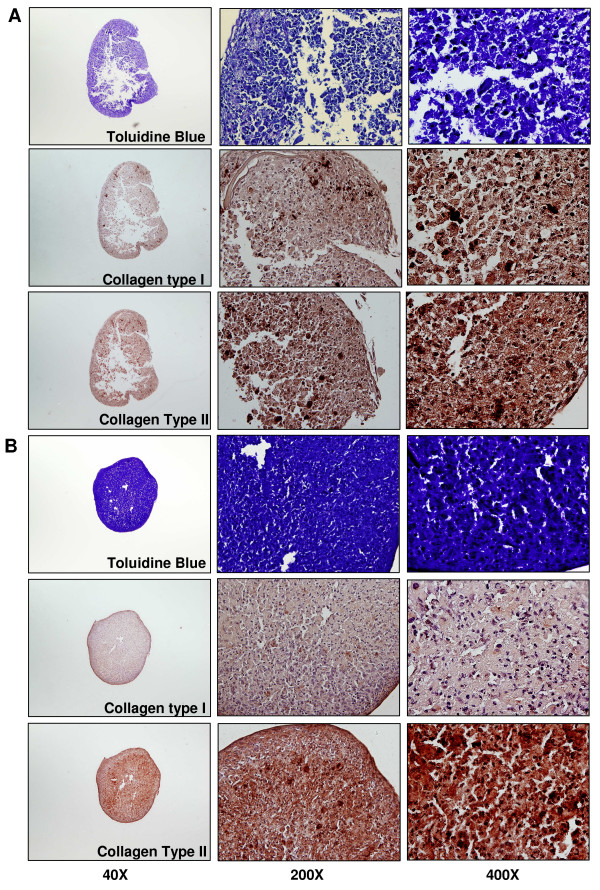
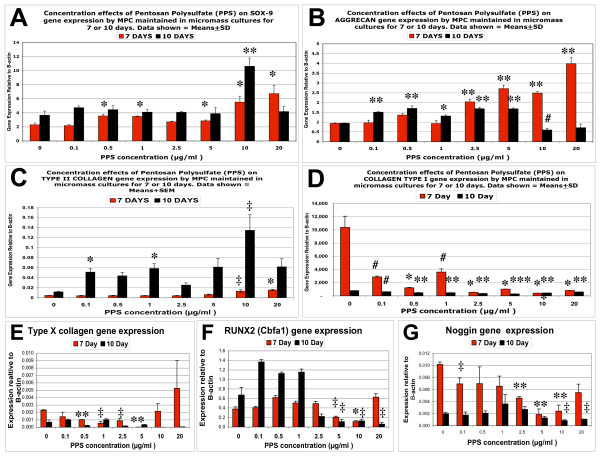
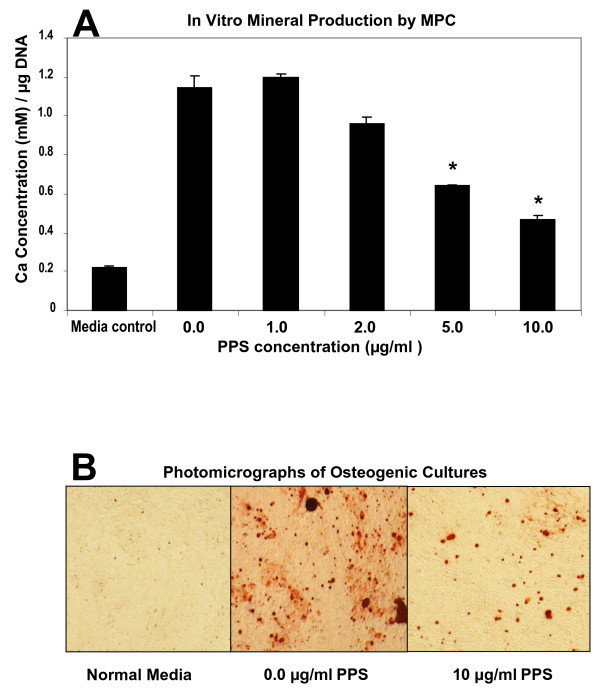
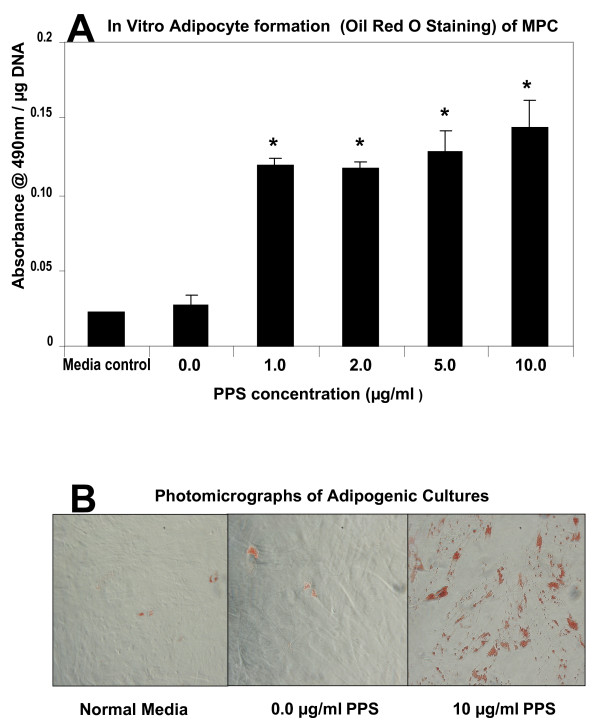
Methods: Human MPCs were maintained in monolayer, pellet or micromass cultures (MMC) for up to 10 days with PPS at concentrations of 0 to 20 microg/ml. MPC viability and proliferation was assessed using the WST-1 assay and 3H-thymidine incorporation into DNA, while apoptosis was monitored by flow cytometry. Proteoglycan (PG) biosynthesis was determined by 35SO42- incorporation and staining with Alcian blue. Proteoglycan and collagen type I and collagen type II deposition in pellet cultures was also examined by Toluidine blue and immunohistochemical staining, respectively. The production of hyaluronan (HA) by MPCs in MMC was assessed by ELISA. The relative outcome of PPS, HA, heparin or dextran sulfate (DS) on PG synthesis was compared in 5-day MMC. Gene expression of MPCs in 7-day and 10-day MMC was examined using real-time PCR. MPC differentiation was investigated by co-culturing with PPS in osteogenic or adipogenic inductive culture media for 28 days.
Results: Significant MPC proliferation was evident by day 3 at PPS concentrations of 1 to 5 microg/ml (P < 0.01). In the presence of 1 to 10 microg/ml PPS, a 38% reduction in IL-4/IFNgamma-induced MPC apoptosis was observed. In 5-day MMC, 130% stimulation of PG synthesis occurred at 2.5 microg/ml PPS (P < 0.0001), while 5.0 microg/ml PPS achieved maximal stimulation in the 7-day and 10-day cultures (P < 0.05). HA and DS at > or = 5 microg/ml inhibited PG synthesis (P < 0.05) in 5-day MMC. Collagen type II deposition by MMC was significant at > or = 0.5 microg/ml PPS (P < 0.001 to 0.05). In MPC-PPS pellet cultures, more PG, collagen type II but less collagen type I was deposited than in controls. Real-time PCR results were consistent with the protein data. At 5 and 10 microg/ml PPS, MPC osteogenic differentiation was suppressed (P < 0.01).
Conclusions: This is the first study to demonstrate that PPS promotes MPC proliferation and chondrogenesis, offering new strategies for cartilage regeneration and repair in osteoarthritic joints.
Figures
Similar articles
-
Pentosan polysulfate binds to STRO-1+ mesenchymal progenitor cells, is internalized, and modifies gene expression: a novel approach of pre-programing stem cells for therapeutic application requiring their chondrogenesis.Stem Cell Res Ther. 2017 Dec 13;8(1):278. doi: 10.1186/s13287-017-0723-y. Stem Cell Res Ther. 2017. PMID: 29237492 Free PMC article.
-
Effects of pentosan polysulfate and polysulfated glycosaminoglycan on chondrogenesis of canine bone marrow-derived mesenchymal stem cells in alginate and micromass culture.J Vet Med Sci. 2017 Jul 7;79(7):1182-1190. doi: 10.1292/jvms.17-0084. Epub 2017 May 27. J Vet Med Sci. 2017. PMID: 28552861 Free PMC article.
-
Pentosan polysulfate sodium promotes redifferentiation to the original phenotype in micromass-cultured canine articular chondrocytes and exerts molecular weight-dependent effects.J Vet Med Sci. 2023 Jun 14;85(6):680-690. doi: 10.1292/jvms.22-0567. Epub 2023 May 8. J Vet Med Sci. 2023. PMID: 37150611 Free PMC article.
-
Pentosan Polysulfate, a Semisynthetic Heparinoid Disease-Modifying Osteoarthritic Drug with Roles in Intervertebral Disc Repair Biology Emulating the Stem Cell Instructive and Tissue Reparative Properties of Heparan Sulfate.Stem Cells Dev. 2022 Aug;31(15-16):406-430. doi: 10.1089/scd.2022.0007. Epub 2022 Mar 14. Stem Cells Dev. 2022. PMID: 35102748 Review.
-
Pentosan Polysulfate Affords Pleotropic Protection to Multiple Cells and Tissues.Pharmaceuticals (Basel). 2023 Mar 13;16(3):437. doi: 10.3390/ph16030437. Pharmaceuticals (Basel). 2023. PMID: 36986536 Free PMC article. Review.
Cited by
-
A Comparison of Two Ovine Lumbar Intervertebral Disc Injury Models for the Evaluation and Development of Novel Regenerative Therapies.Global Spine J. 2018 Dec;8(8):847-859. doi: 10.1177/2192568218779988. Epub 2018 Jun 10. Global Spine J. 2018. PMID: 30560038 Free PMC article.
-
Impaired instructive and protective barrier functions of the endothelial cell glycocalyx pericellular matrix is impacted in COVID-19 disease.J Cell Mol Med. 2024 Aug;28(16):e70033. doi: 10.1111/jcmm.70033. J Cell Mol Med. 2024. PMID: 39180511 Free PMC article. Review.
-
Biomaterials-Induced Stem Cells Specific Differentiation Into Intervertebral Disc Lineage Cells.Front Bioeng Biotechnol. 2020 Feb 7;8:56. doi: 10.3389/fbioe.2020.00056. eCollection 2020. Front Bioeng Biotechnol. 2020. PMID: 32117935 Free PMC article. Review.
-
Treatment with pentosan polysulphate in patients with MPS I: results from an open label, randomized, monocentric phase II study.J Inherit Metab Dis. 2016 Nov;39(6):831-837. doi: 10.1007/s10545-016-9974-5. Epub 2016 Sep 2. J Inherit Metab Dis. 2016. PMID: 27590017 Clinical Trial.
-
Independent chondrogenic potential of canine bone marrow-derived mesenchymal stem cells in monolayer expansion cultures decreases in a passage-dependent pattern.J Vet Med Sci. 2018 Nov 9;80(11):1681-1687. doi: 10.1292/jvms.18-0202. Epub 2018 Sep 11. J Vet Med Sci. 2018. PMID: 30210068 Free PMC article.
References
-
- Spagnoli A, Longobardi L, O'Rear L. Cartilage disorders: potential therapeutic use of mesenchymal stem cells. Endocr Dev. 2005;9:17–30. full_text. - PubMed
MeSH terms
Substances
LinkOut - more resources
Full Text Sources
Other Literature Sources
