

miR-17-92 expression in differentiated T cells - implications for cancer immunotherapy
- PMID: 20167088
- PMCID: PMC2836279
- DOI: 10.1186/1479-5876-8-17
miR-17-92 expression in differentiated T cells - implications for cancer immunotherapy
Abstract
Background: Type-1 T cells are critical for effective anti-tumor immune responses. The recently discovered microRNAs (miRs) are a large family of small regulatory RNAs that control diverse aspects of cell function, including immune regulation. We identified miRs differentially regulated between type-1 and type-2 T cells, and determined how the expression of such miRs is regulated.
Methods: We performed miR microarray analyses on in vitro differentiated murine T helper type-1 (Th1) and T helper type-2 (Th2) cells to identify differentially expressed miRs. We used quantitative RT-PCR to confirm the differential expression levels. We also used WST-1, ELISA, and flow cytometry to evaluate the survival, function and phenotype of cells, respectively. We employed mice transgenic for the identified miRs to determine the biological impact of miR-17-92 expression in T cells.
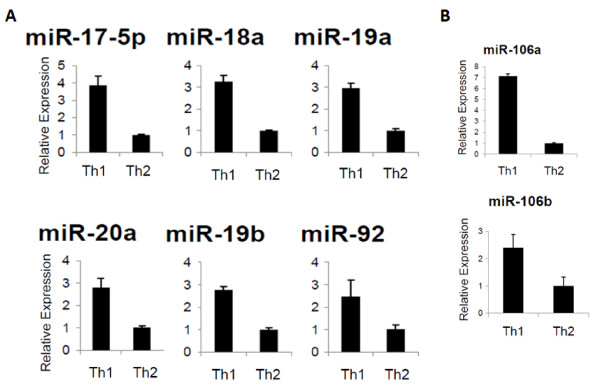
Results: Our initial miR microarray analyses revealed that the miR-17-92 cluster is one of the most significantly over-expressed miR in murine Th1 cells when compared with Th2 cells. RT-PCR confirmed that the miR-17-92 cluster expression was consistently higher in Th1 cells than Th2 cells. Disruption of the IL-4 signaling through either IL-4 neutralizing antibody or knockout of signal transducer and activator of transcription (STAT)6 reversed the miR-17-92 cluster suppression in Th2 cells. Furthermore, T cells from tumor bearing mice and glioma patients had decreased levels of miR-17-92 when compared with cells from non-tumor bearing counterparts. CD4+ T cells derived from miR-17-92 transgenic mice demonstrated superior type-1 phenotype with increased IFN-gamma production and very late antigen (VLA)-4 expression when compared with counterparts derived from wild type mice. Human Jurkat T cells ectopically expressing increased levels of miR-17-92 cluster members demonstrated increased IL-2 production and resistance to activation-induced cell death (AICD).
Conclusion: The type-2-skewing tumor microenvironment induces the down-regulation of miR-17-92 expression in T cells, thereby diminishing the persistence of tumor-specific T cells and tumor control. Genetic engineering of T cells to express miR-17-92 may represent a promising approach for cancer immunotherapy.
Figures


Similar articles
-
MicroRNA-21 limits in vivo immune response-mediated activation of the IL-12/IFN-gamma pathway, Th1 polarization, and the severity of delayed-type hypersensitivity.J Immunol. 2011 Sep 15;187(6):3362-73. doi: 10.4049/jimmunol.1101235. Epub 2011 Aug 17. J Immunol. 2011. PMID: 21849676 Free PMC article.
-
Regulation of interleukin (IL)-18 receptor alpha chain expression on CD4(+) T cells during T helper (Th)1/Th2 differentiation. Critical downregulatory role of IL-4.J Exp Med. 2001 Jul 16;194(2):143-53. doi: 10.1084/jem.194.2.143. J Exp Med. 2001. PMID: 11457889 Free PMC article.
-
Human T helper (Th) cell lineage commitment is not directly linked to the secretion of IFN-gamma or IL-4: characterization of Th cells isolated by FACS based on IFN-gamma and IL-4 secretion.Eur J Immunol. 2005 Sep;35(9):2709-17. doi: 10.1002/eji.200425957. Eur J Immunol. 2005. PMID: 16106470
-
IL-2 family cytokines: new insights into the complex roles of IL-2 as a broad regulator of T helper cell differentiation.Curr Opin Immunol. 2011 Oct;23(5):598-604. doi: 10.1016/j.coi.2011.08.003. Epub 2011 Aug 31. Curr Opin Immunol. 2011. PMID: 21889323 Free PMC article. Review.
-
The molecular basis of T helper 1 and T helper 2 cell differentiation.Trends Cell Biol. 2000 Dec;10(12):542-50. doi: 10.1016/s0962-8924(00)01856-0. Trends Cell Biol. 2000. PMID: 11121747 Review.
Cited by
-
MicroRNAs in T Cell-Immunotherapy.Int J Mol Sci. 2022 Dec 23;24(1):250. doi: 10.3390/ijms24010250. Int J Mol Sci. 2022. PMID: 36613706 Free PMC article. Review.
-
Deletion of the Mir-106b~ 25 MicroRNA cluster attenuates atherosclerosis in Apolipoprotein E knockout mice.Lipids Health Dis. 2019 Dec 3;18(1):208. doi: 10.1186/s12944-019-1155-8. Lipids Health Dis. 2019. PMID: 31796057 Free PMC article.
-
Dynamically expressed microRNA-15b modulates the activities of CD8+ T lymphocytes in mice with Lewis lung carcinoma.J Transl Med. 2013 Mar 21;11:71. doi: 10.1186/1479-5876-11-71. J Transl Med. 2013. PMID: 23517578 Free PMC article.
-
High serum miR-19a levels are associated with inflammatory breast cancer and are predictive of favorable clinical outcome in patients with metastatic HER2+ inflammatory breast cancer.PLoS One. 2014 Jan 8;9(1):e83113. doi: 10.1371/journal.pone.0083113. eCollection 2014. PLoS One. 2014. PMID: 24416156 Free PMC article.
-
Emerging role of miRNAs as liquid biopsy markers for prediction of glioblastoma multiforme prognosis.J Mol Neurosci. 2021 Apr;71(4):836-844. doi: 10.1007/s12031-020-01706-5. Epub 2020 Sep 28. J Mol Neurosci. 2021. PMID: 32989634
References
-
- Fujita M, Zhu X, Sasaki K, Ueda R, Low KL, Pollack IF, Okada H. Inhibition of STAT3 promotes the efficacy of adoptive transfer therapy using type-1 CTLs by modulation of the immunological microenvironment in a murine intracranial glioma. J Immunol. 2008;180:2089–2098. - PubMed
-
- Fujita M, Zhu X, Ueda R, Sasaki K, Kohanbash G, Kastenhuber ER, McDonald HA, Gibson GA, Watkins SC, Muthuswamy R. Effective Immunotherapy against Murine Gliomas Using Type 1 Polarizing Dendritic Cells--Significant Roles of CXCL10. Cancer Res. 2009;69:1587–1595. doi: 10.1158/0008-5472.CAN-08-2915. - DOI - PMC - PubMed
Publication types
MeSH terms
Substances
Grants and funding
LinkOut - more resources
Full Text Sources
Other Literature Sources
Research Materials
Miscellaneous
