

Modeling the error of continuous glucose monitoring sensor data: critical aspects discussed through simulation studies
- PMID: 20167162
- PMCID: PMC2825619
- DOI: 10.1177/193229681000400102
Modeling the error of continuous glucose monitoring sensor data: critical aspects discussed through simulation studies
Abstract
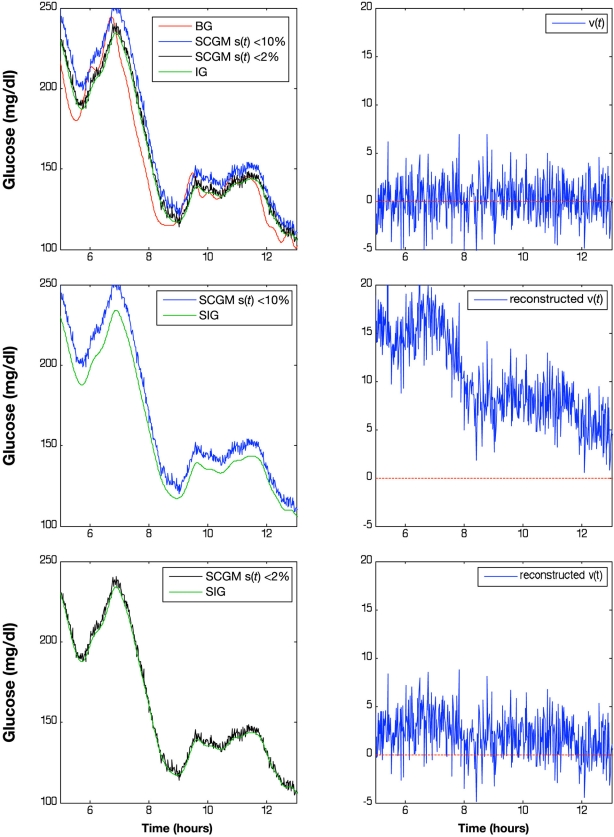
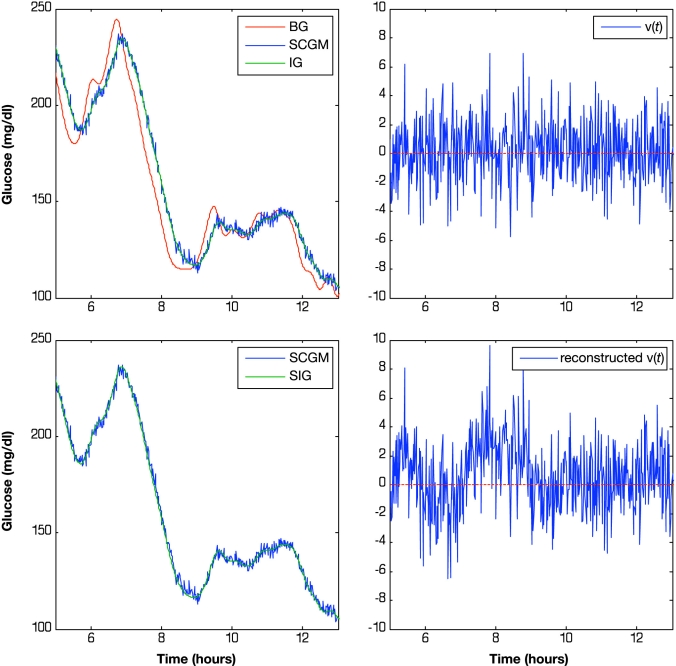
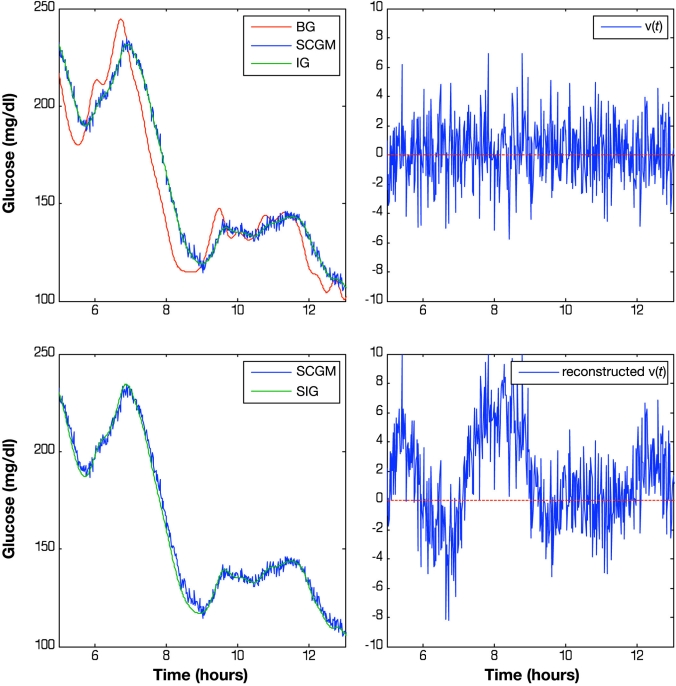
Background: Knowing the statistical properties of continuous glucose monitoring (CGM) sensor errors can be important in several practical applications, e.g., in both open- and closed-loop control algorithms. Unfortunately, modeling the accuracy of CGM sensors is very difficult for both experimental and methodological reasons. It has been suggested that the time series of CGM sensor errors can be described as realization of the output of an autoregressive (AR) model of first order driven by a white noise process. The AR model was identified exploiting several reference blood glucose (BG) samples (collected frequently in parallel to the CGM signal), a procedure to recalibrate CGM data, and a linear time-invariant model of blood-to-interstitium glucose (BG-to-IG) kinetics. By resorting to simulation, this work shows that some assumptions made in the Breton and Kovatchev modeling approach may significantly affect the estimated sensor error and its statistical properties.
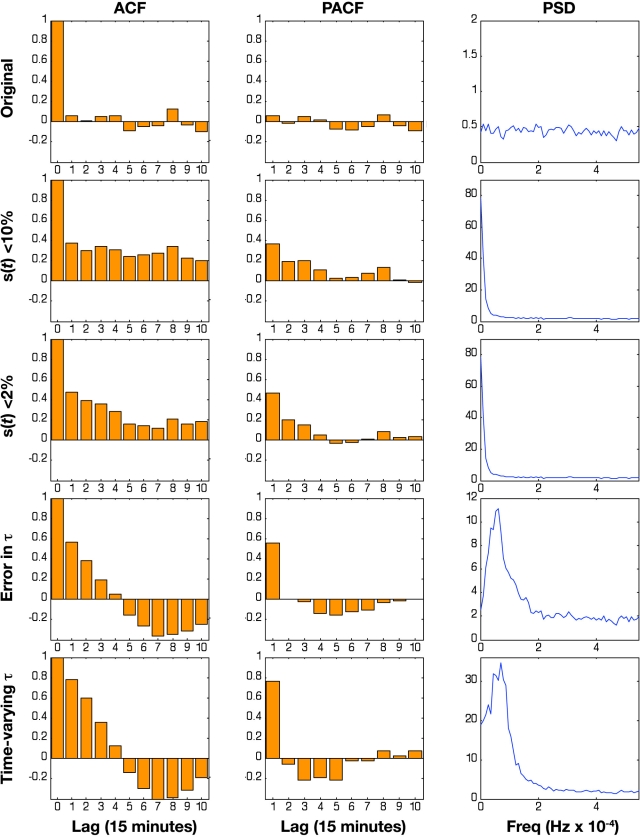
Method: Three simulation studies were performed. The first simulation was devoted to assessing the influence of CGM data recalibration, whereas the second and third simulations examined the role of the BG-to-IG kinetic model. Analysis was performed by comparing the "original" (synthetically generated) time series of sensor errors vs its "reconstructed" version in both time and frequency domains.
Results: Even small errors either in CGM data recalibration or in the description of BG-to-IG dynamics can severely affect the possibility of correctly reconstructing the statistical properties of sensor error. In particular, even if CGM sensor error is a white noise process, a spurious correlation among its samples originates from suboptimal recalibration or from imperfect knowledge of the BG-to-IG kinetics.
Conclusions: Modeling the statistical properties of CGM sensor errors from data collected in vivo is difficult because it requires perfect calibration and perfect knowledge of BG-to-IG dynamics. Results suggest that correct characterization of CGM sensor error is still an open issue and requires further development upon the pioneering contribution of Breton and Kovatchev.
2010 Diabetes Technology Society.
Figures
Similar articles
-
Modeling the glucose sensor error.IEEE Trans Biomed Eng. 2014 Mar;61(3):620-9. doi: 10.1109/TBME.2013.2284023. Epub 2013 Sep 30. IEEE Trans Biomed Eng. 2014. PMID: 24108706
-
Model of glucose sensor error components: identification and assessment for new Dexcom G4 generation devices.Med Biol Eng Comput. 2015 Dec;53(12):1259-69. doi: 10.1007/s11517-014-1226-y. Epub 2014 Nov 23. Med Biol Eng Comput. 2015. PMID: 25416850
-
Enhanced accuracy of continuous glucose monitoring by online extended kalman filtering.Diabetes Technol Ther. 2010 May;12(5):353-63. doi: 10.1089/dia.2009.0158. Diabetes Technol Ther. 2010. PMID: 20388045
-
Amperometric glucose sensors: sources of error and potential benefit of redundancy.J Diabetes Sci Technol. 2010 Jan 1;4(1):221-5. doi: 10.1177/193229681000400127. J Diabetes Sci Technol. 2010. PMID: 20167187 Free PMC article. Review.
-
Estimating plasma glucose from interstitial glucose: the issue of calibration algorithms in commercial continuous glucose monitoring devices.Sensors (Basel). 2010;10(12):10936-52. doi: 10.3390/s101210936. Epub 2010 Dec 3. Sensors (Basel). 2010. PMID: 22163505 Free PMC article. Review.
Cited by
-
Glucose variability.Diabetes. 2013 May;62(5):1398-404. doi: 10.2337/db12-1396. Diabetes. 2013. PMID: 23613565 Free PMC article.
-
Continuous glucose monitoring: a review for behavioral researchers.Psychosom Med. 2012 May;74(4):356-65. doi: 10.1097/PSY.0b013e31825769ac. Psychosom Med. 2012. PMID: 22582333 Free PMC article. Review.
-
A composite model of glucagon-glucose dynamics for in silico testing of bihormonal glucose controllers.J Diabetes Sci Technol. 2013 Jul 1;7(4):941-51. doi: 10.1177/193229681300700416. J Diabetes Sci Technol. 2013. PMID: 23911175 Free PMC article.
-
Comparison between one-point calibration and two-point calibration approaches in a continuous glucose monitoring algorithm.J Diabetes Sci Technol. 2014 Jul;8(4):709-19. doi: 10.1177/1932296814531356. Epub 2014 Apr 21. J Diabetes Sci Technol. 2014. PMID: 24876420 Free PMC article.
-
Continuous glucose monitoring in neonates: a review.Matern Health Neonatol Perinatol. 2017 Oct 17;3:18. doi: 10.1186/s40748-017-0055-z. eCollection 2017. Matern Health Neonatol Perinatol. 2017. PMID: 29051825 Free PMC article. Review.
References
-
- Klonoff DC. Continuous glucose monitoring: roadmap for 21st century diabetes therapy. Diabetes Care. 2005;28(5):1231–1239. - PubMed
-
- Garg K, Zisser H, Schwartz S, Bailey T, Kaplan R, Ellis S, Jovanovic L. Improvement in glycemic excursions with a transcutaneous, real-time continuous glucose sensor. Diabetes Care. 2006;29(1):44–50. - PubMed
-
- Deiss D, Bolinder J, Riveline J, Battelino T, Bosi E, Tubiana-Rufi N, Kerr D, Phillip M. Improved glycemic control in poorly controlled patients with type 1 diabetes using real-time continuous glucose monitoring. Diabetes Care. 2006;29(12):2730–2732. - PubMed
-
- Juvenile Diabetes Research Foundation Continuous Glucose Monitoring Study Group. Tamborlane WV, Beck RW, Bode BW, Buckingham B, Chase HP, Clemons R, Fiallo-Scharer R, Fox LA, Gilliam LK, Hirsch IB, Huang ES, Kollman C, Kowalski AJ, Laffel L, Lawrence JM, Lee J, Mauras N, O'Grady M, Ruedy KJ, Tansey M, Tsalikian E, Weinzimer S, Wilson DM, Wolpert H, Wysocki T, Xing D. Continuous glucose monitoring and intensive treatment of type 1 diabetes. N Engl J Med. 2008;359(14):1464–1476. - PubMed
-
- Clarke WL, Anderson S, Kovatchev B. Evaluating clinical accuracy of continuous glucose monitoring systems: Continuous Glucose-Error Grid Analysis (CG-EGA) Curr Diabetes Rev. 2008;4(3):193–199. - PubMed
Publication types
MeSH terms
Substances
LinkOut - more resources
Full Text Sources
Other Literature Sources
Medical
Research Materials
