

Simulation environment to evaluate closed-loop insulin delivery systems in type 1 diabetes
- PMID: 20167177
- PMCID: PMC2825634
- DOI: 10.1177/193229681000400117
Simulation environment to evaluate closed-loop insulin delivery systems in type 1 diabetes
Abstract
Background: Closed-loop insulin delivery systems linking subcutaneous insulin infusion to real-time continuous glucose monitoring need to be evaluated in humans, but progress can be accelerated with the use of in silico testing. We present a simulation environment designed to support the development and testing of closed-loop insulin delivery systems in type 1 diabetes mellitus (T1DM).
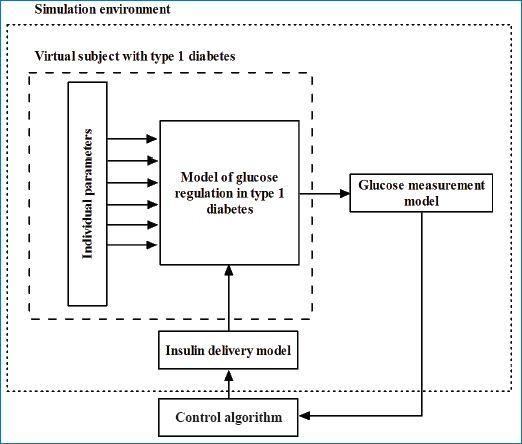
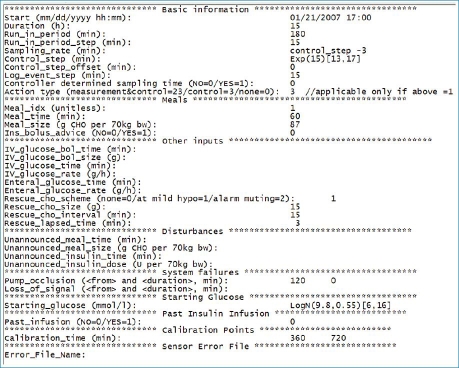
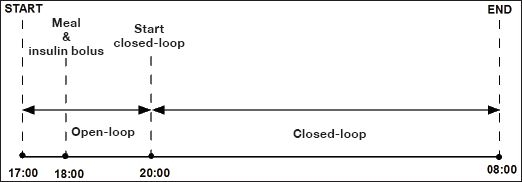
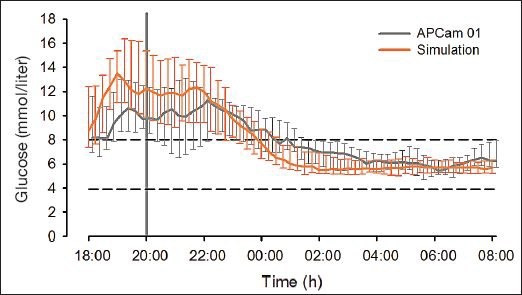
Methods: The principal components of the simulation environment include a mathematical model of glucose regulation representing a virtual population with T1DM, the glucose measurement model, and the insulin delivery model. The simulation environment is highly flexible. The user can specify an experimental protocol, define a population of virtual subjects, choose glucose measurement and insulin delivery models, and specify outcome measures. The environment provides graphical as well as numerical outputs to enable a comprehensive analysis of in silico study results. The simulation environment is validated by comparing its predictions against a clinical study evaluating overnight closed-loop insulin delivery in young people with T1DM using a model predictive controller.
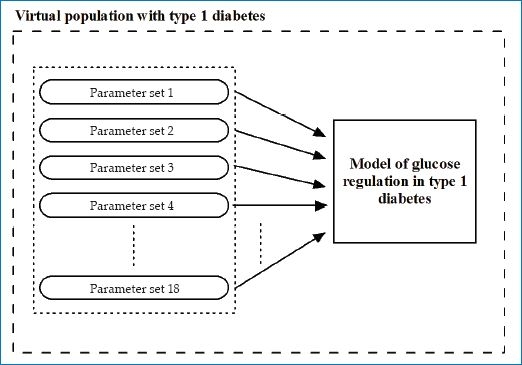
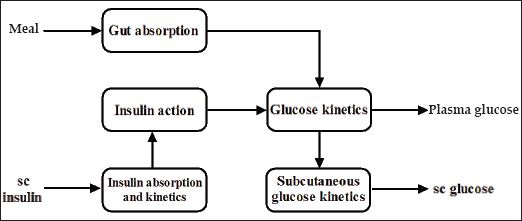
Results: The simulation model of glucose regulation is described, and population values of 18 synthetic subjects are provided. The validation study demonstrated that the simulation environment was able to reproduce the population results of the clinical study conducted in young people with T1DM.
Conclusions: Closed-loop trials in humans should be preceded and concurrently guided by highly efficient and resource-saving computer-based simulations. We demonstrate validity of population-based predictions obtained with our simulation environment.
2010 Diabetes Technology Society.
Figures

Similar articles
-
Overnight closed-loop insulin delivery with model predictive control: assessment of hypoglycemia and hyperglycemia risk using simulation studies.J Diabetes Sci Technol. 2009 Sep 1;3(5):1109-20. doi: 10.1177/193229680900300514. J Diabetes Sci Technol. 2009. PMID: 20144424 Free PMC article.
-
Closed-loop artificial pancreas using subcutaneous glucose sensing and insulin delivery and a model predictive control algorithm: preliminary studies in Padova and Montpellier.J Diabetes Sci Technol. 2009 Sep 1;3(5):1014-21. doi: 10.1177/193229680900300504. J Diabetes Sci Technol. 2009. PMID: 20144414 Free PMC article.
-
In silico preclinical trials: a proof of concept in closed-loop control of type 1 diabetes.J Diabetes Sci Technol. 2009 Jan;3(1):44-55. doi: 10.1177/193229680900300106. J Diabetes Sci Technol. 2009. PMID: 19444330 Free PMC article.
-
Is an artificial pancreas (closed-loop system) for Type 1 diabetes effective?Diabet Med. 2019 Mar;36(3):279-286. doi: 10.1111/dme.13816. Epub 2018 Oct 16. Diabet Med. 2019. PMID: 30183096 Review.
-
Closed loop insulin delivery in diabetes.Best Pract Res Clin Endocrinol Metab. 2015 Jun;29(3):315-25. doi: 10.1016/j.beem.2015.03.001. Epub 2015 Mar 10. Best Pract Res Clin Endocrinol Metab. 2015. PMID: 26051293 Review.
Cited by
-
Two Decades of Research in Artificial Pancreas: Insights from a Bibliometric Analysis.J Diabetes Sci Technol. 2022 Mar;16(2):434-445. doi: 10.1177/19322968211005500. Epub 2021 Apr 15. J Diabetes Sci Technol. 2022. PMID: 33853377 Free PMC article.
-
Innovations in technology for the treatment of diabetes: clinical development of the artificial pancreas (an autonomous system).J Diabetes Sci Technol. 2011 May 1;5(3):804-26. doi: 10.1177/193229681100500336. J Diabetes Sci Technol. 2011. PMID: 21722597 Free PMC article.
-
Home Use of Day-and-Night Hybrid Closed-Loop Insulin Delivery in Suboptimally Controlled Adolescents With Type 1 Diabetes: A 3-Week, Free-Living, Randomized Crossover Trial.Diabetes Care. 2016 Nov;39(11):2019-2025. doi: 10.2337/dc16-1094. Epub 2016 Sep 9. Diabetes Care. 2016. PMID: 27612500 Free PMC article. Clinical Trial.
-
GLYFE: review and benchmark of personalized glucose predictive models in type 1 diabetes.Med Biol Eng Comput. 2022 Jan;60(1):1-17. doi: 10.1007/s11517-021-02437-4. Epub 2021 Nov 9. Med Biol Eng Comput. 2022. PMID: 34751904 Review.
-
A Neural-Network-Based Approach to Personalize Insulin Bolus Calculation Using Continuous Glucose Monitoring.J Diabetes Sci Technol. 2018 Mar;12(2):265-272. doi: 10.1177/1932296818759558. J Diabetes Sci Technol. 2018. PMID: 29493356 Free PMC article.
References
-
- Hovorka R. Continuous glucose monitoring and closed-loop systems. Diabet Med. 2006;23(1):1–12. - PubMed
-
- Hovorka R. The future of continuous glucose monitoring: closed loop. Curr Diabetes Rev. 2008;4(3):269–279. - PubMed
-
- Hovorka R, Wilinska ME, Chassin LJ, Dunger DB. Roadmap to the artificial pancreas. Diabetes Res Clin Pract. 2006;74(Suppl 2):S178–S182.
-
- JDRF Artificial Pancreas Project. 2008. http://www.jdrf.org. Accessed on May 20, 2009.
-
- Buckingham BA, Block J, Wilson D, Rebrin K, Steil G. Novolog pharmacodynamics in toddlers. Diabetes. 2005;54(Suppl 1):A454.
Publication types
MeSH terms
Substances
Grants and funding
LinkOut - more resources
Full Text Sources
Other Literature Sources
Medical
