. 2010 May 5;167(2):439-55.
doi: 10.1016/j.neuroscience.2010.02.032. Epub 2010 Feb 16.

Differential effects of dopamine and opioid receptor blockade on motivated Coca-Cola drinking behavior and associated changes in brain, skin and muscle temperatures

Affiliations

Differential effects of dopamine and opioid receptor blockade on motivated Coca-Cola drinking behavior and associated changes in brain, skin and muscle temperatures

E A Kiyatkin. Neuroscience. .

Abstract

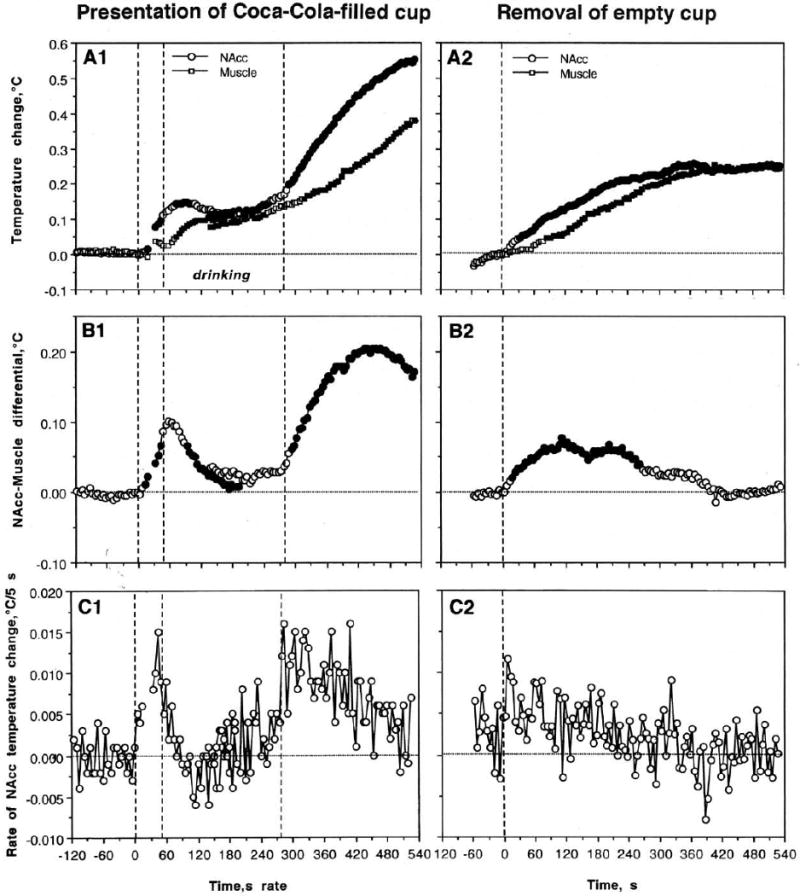
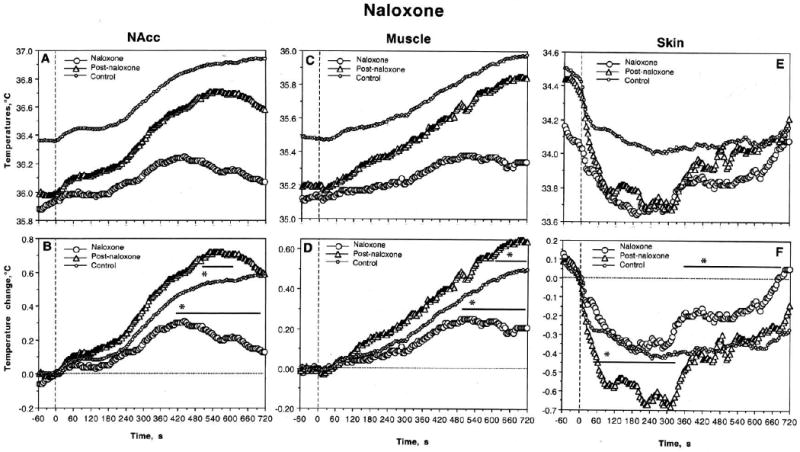
Although pharmacological blockade of both dopamine (DA) and opiate receptors has an inhibiting effect on appetitive motivated behaviors, it is still unclear which physiological mechanisms affected by these treatments underlie the behavioral deficit. To clarify this issue, we examined how pharmacological blockade of either DA (SCH23390+eticlopride at 0.2 mg/kg each) or opioid receptors (naloxone 1 mg/kg) affects motor activity and temperature fluctuations in the nucleus accumbens (NAcc), temporal muscle, and facial skin associated with motivated Coca-Cola drinking behavior in rats. In drug-free conditions, presentation of a cup containing 5 ml of Coca-Cola induced locomotor activation and rapid NAcc temperature increases, which both transiently decreased during drinking, and phasically increased again after the cup was emptied. Muscle temperatures followed this pattern, but increases were weaker and more delayed than those in the NAcc. Skin temperature rapidly dropped after cup presentation, remained at low levels during consumption, and slowly restored during post-consumption behavioral activation. By itself, DA receptor blockade induced robust decrease in spontaneous locomotion, moderate increases in brain and muscle temperatures, and a relative increase in skin temperatures, suggesting metabolic activation coupled with adynamia. Following this treatment (approximately 180 min), motor activation to cup presentation and Coca-Cola consumption were absent, but rats showed NAcc and muscle temperature increases following cup presentation comparable to control. Therefore, DA receptor blockade does not affect significantly central and peripheral autonomic responses to appetitive stimuli, but eliminates their behavior-activating effects, thus disrupting appetitive behavior and blocking consumption. Naloxone alone slightly decreased brain and muscle temperatures and increased skin temperatures, pointing at the enhanced heat loss and possible minor inhibition of basal metabolic activity. This treatment (approximately 60 min) had minimal effects on the latencies of drinking, but increased its total duration, with licking interrupted by pauses and retreats. This behavioral attenuation was coupled with weaker than in control locomotor activation and diminished temperature fluctuations in each recording location. Therefore, attenuation of normal behavioral and physiological responses to appetitive stimuli appears to underlie modest inhibiting effects of opiate receptor blockade on motivated behavior and consumption.


Figures

Fig. 1
Fig. 1
Mean changes in absolute (A) and relative temperatures (B), temperature differentials (C), and locomotion (D) following presentation of a Coca-Cola-filled cup (left panel) and removal of empty cup (right panel) in drug-naive control conditions. n shows numbers of averaged tests and filled symbols show values significantly different from baseline. One-way ANOVA with repeated measures was used for statistical evaluation of temperatures and locomotion. F values for cup presentation are: NAcc – F33,1053=27.42; Skin – 14.70; Muscle – 26.01; locomotion – 2.73; at least p<0.01 each. F values for cup removal are: NAcc - F14,464=6.36; Skin – 3.87; Muscle – 4.67; locomotion - 1.64; at least p<0.05 each.
Fig. 2
Fig. 2
Phasic changes in NAcc and temporal muscle temperatures (A) and NAcc-muscle temperature differentials (B) associated with key events of motivated drinking behavior (left panel) and subsequent removal of empty case from the cage (right panel). The bottom graphs (C) show rates of NAcc temperature change (mean difference between each subsequent 5-s values). Three vertical lines on the left panel mark the moments of cup presentation, initiation of drinking behavior, and its end. Horizontal hatched lines show zero values or no change for each parameter. Statistical evaluation for cup presentation was done separately for each of three events, with plus (following) and minus (preceding) time comparisons. Filled symbols show values statistically significant from reference points (either a 5-s value immediately preceding the start and end of drinking or the first 5-s value after these events). F values for cup presentation are: NAcc F32,164=4.88; p<0.001; Muscle=0.58, not significant, NAcc-muscle differential=5.64, p<0.001. F values for initiation of drinking: (1) preceding drinking onset: NAcc F32,164=36.46, p<0.001; Muscle=1.73, not significant; Nacc-muscle differential=23.99, p<0.001; (2) following drinking onset: NAcc F32,989=2.36; Muscle=15.05, NAcc-muscle differential=22.47, each p<0.001. F values for changes following the end of drinking: (1) preceding end of drinking: NAcc F32,956=5.01, p<0.001; Muscle =6.34, p<0.001, Nacc-muscle differential=0.59; (2) following drinking offset: NAcc F32,1022=57.13, Muscle =20.17, NAcc-muscle differential=57.13, all are p<0.001. F values for empty cup removal: NAcc F30,960=24.54; Muscle=8.00; NAcc-Muscle differential= 3.27 (all p<0.01). While most changes are significant, note quantitative differences in F values that show the strength of the effect.
Fig. 3
Fig. 3
Mean changes in relative temperatures (A), temperature differentials (B), and locomotion (C) induced by sc administration of a mixture of DA receptor blockers (SCH 23390 0.2 mg/kg and eticlopride 0.2 mg/kg; left panel; marked as A1, b2, and C1), naloxone (1 mg/kg; middle panel; marked as A2, B2, and C2), and saline (right panel; marked as A3, B3 and C3) in freely moving rats. Vertical hatched lines (0 min) show the moment of drug injections. n is number of averaged tests. The effects of each treatment were significant as evaluated with repeated measure ANOVA. F values for the effects of DA receptor blockers are: NAcc F5,185=4.06; Muscle=3.13, Skin=5.19, locomotion=4.66 (all at least p<0.01). F values for the effects of naloxone are: NAcc F7,247=11.92; Muscle=13.03, Skin=6.08, Locomotion=5.50 (all at least p<0.01). F values for the effects of saline are: NAcc F11,371=7.40; Muscle=6.60, Skin=7.12, Locomotion=6.03 (all at least p<0.01). Values significantly different from baseline (the last pre-injection value) are shown by filled symbols. For clarity, standard errors are shown only for locomotion.
Fig. 4
Fig. 4
Mean changes in absolute (A) and relative temperatures (B), temperature differentials (C), and locomotion (D) induce by cup presentation (left panel) and cup removal (left panel) in rats during full DA receptor blockade. Vertical hatched lines show the moments of cup presentation or removal. Both procedures induced significant but quantitatively different effects on NAcc (F9,309=8.96, F7,191=2,13, respectively, for cup presentation and removal; p<0.01) and muscle temperatures (6.13 and 2.63; p<0.01), no effects on skin temperature (1.65 and 0.75) and locomotion. Values significantly different from baseline (the last pre-injection value) are shown by filled symbols. For clarity, standard errors are shown only for absolute temperatures and locomotion.
Fig. 5
Fig. 5
Differences in high-speed temperature dynamics in the NAcc (A), temporal muscle (B), and skin (C) following cup presentation (left panel) and cup removal (right panel) in rats in drug-naive, control conditions (circle) and during DA receptor blockade (triangle). As can be seen, temperatures in each location changed similarly in both conditions immediately after cup presentation, but then strongly diverged. While NAcc and muscle temperatures relatively decreased in control conditions during drinking behavior, both parameters monotonically increased during DA receptor blockade, when the rat was generally adynamic and showed no interest in presented cup. In control conditions, NAcc and muscle temperatures showed the second, stronger increase after cup was emptied and the rats resumed searching activity. Because of this, both temperatures increased much stronger and for a longer time in control than during DA receptor blockade. Changes in skin temperature during DA receptor blockade were greatly attenuated compared to control conditions. Solid, fat lanes with asterisks show significant (p<0.05) between-condition differences.
Fig. 6
Fig. 6
Mean changes in absolute (A) and relative temperatures (B), temperature differentials (C), and locomotion (D) following the first (left panel) and second (right panel) cup presentation at different times (+40 and +180 min) of naloxone administration. Vertical hatched lines show the moments of cup presentation. Both procedures induced significant but quantitatively different effects on NAcc (F7,247=2.59, F7,247=5.66, respectively, for first and second cup presentations p<0.001), muscle (1.62 and 4.00; p<0.05) and skin temperatures (1.76 and 10.37) as well as locomotion (2.31 and 2.12; p<0.01 both). Values significantly different from baseline are shown by filled symbols. For clarity, standard errors are shown only for absolute temperatures and locomotion.
Fig. 7
Fig. 7
High-speed temperature dynamics associated with Coca-Cola drinking behavior in rats during opioid receptor blockade (Naloxone; 40-min post-injection), in post-blockade period (Post-naloxone; 3 hrs post-injection) and in drug-free control conditions (Control). The changes are shown separately for each recording location (left, NAcc; middle, Muscle; right, Skin) and for absolute (top) and relative (bottom) temperatures. As can be seen, despite much lower NAcc temperatures in the naloxone group (A), its relative change associated with cup presentation and subsequent drinking behavior was much lower than in controls both at the initial and post-drinking periods (B). In contrast, these changes were even stronger than in controls during the second, post-naloxone test. Differences in muscle (C and D) and skin (E and F) temperatures were similar but less pronounced.

Similar articles

References

    1. Agmo A, Galvan A, Talamantes B. Reward and reinforcement produced by drinking sucrose: two processes that may depend on different neurotransmitters. Pharmacol Biochem Behav. 1995;52:403–414. - PubMed
    1. Altschule MD. Emotion and circulation. Circulation. 1951;3:444–454. - PubMed
    1. Arbisi PA, Billington CJ, Levine AS. The effect of naltrexone on taste detection and recognition threshold. Appetite. 1999;32:241–249. - PubMed
    1. Baker M, Cronin M, Mountjoy D. Variability of skin temperature in the waking monkey. Am J Physiol. 1976;230:449–455. - PubMed
    1. Barbano MF, Cador M. Differential regulation of the consummatory, motivational and anticipatory aspects of feeding behavior by dopaminergic and opioidergic drugs. Neuropsychopharmacology. 2006;31:1371–1381. - PubMed

Publication types

MeSH terms