. 2010 May 14;285(20):14898-14908.
doi: 10.1074/jbc.M110.104232. Epub 2010 Feb 18.

Interleukin-7 compartmentalizes its receptor signaling complex to initiate CD4 T lymphocyte response

Affiliations

Interleukin-7 compartmentalizes its receptor signaling complex to initiate CD4 T lymphocyte response

Thierry Rose et al. J Biol Chem. .

Retraction in

Abstract

Interleukin (IL)-7 is a central cytokine that controls homeostasis of the CD4 T lymphocyte pool. Here we show on human primary cells that IL-7 binds to preassembled receptors made up of proprietary chain IL-7Ralpha and the common chain gammac shared with IL-2, -4, -9, -15, and -21 receptors. Upon IL-7 binding, both chains are driven in cholesterol- and sphingomyelin-rich rafts where associated signaling proteins Jak1, Jak3, STAT1, -3, and -5 are found to be phosphorylated. Meanwhile the IL-7.IL-7R complex interacts with the cytoskeleton that halts its diffusion as measured by single molecule fluorescence autocorrelated spectroscopy monitored by microimaging. Comparative immunoprecipitations of IL-7Ralpha signaling complex from non-stimulated and IL-7-stimulated cells confirmed recruitment of proteins such as STATs, but many others were also identified by mass spectrometry from two-dimensional gels. Among recruited proteins, two-thirds are involved in cytoskeleton and raft formation. Thus, early events leading to IL-7 signal transduction involve its receptor compartmentalization into membrane nanodomains and cytoskeleton recruitment.


Figures

FIGURE 1.
FIGURE 1.
FCS analysis of IL-7R chain diffusion. Normalized ACF G(τ) were plotted from 10 averaged acquisitions versus diffusion times τD (log scale in seconds) in panel E for rhodamine-6G (a), SA488 (b), and anti-IL-7Rα mAbb·SA488 (c) in colorless completed RPMI medium fitted as the three-dimensional diffusion particle according to Equation 1. ACF of γc (d) and IL-7Rα (e) were labeled with their respective mAbb·SA488, IL-7Rα·mAbb·SA488 in the presence of unlabeled IL-7 (g) was plotted as mixed two-/three-dimensional diffusion particles at the surface of CD4 T cells analyzed at ω02 = 70 × 103 nm2 and fitted with Equation 4. Normalized CCF were also plotted from 10 averaged acquisitions for IL-7Rα·mAbb·SA488·γc·mAbb·SA633 (f) and IL-7Rα·mAbb·SA488·γc·IL-7b·SA633 (h) considered as two-dimensional diffusion particles at the surface of CD4 T cells. Residuals from fitting with different mathematical diffusion models are given, for example, in panels A-C for IL-7Rα·mAbb·SA488 after ACF fitting with models accounting for one two-dimensional component (A, Equation 3), one two-dimensional and one three-dimensional (B, Equation 4), and two two-dimensional and one thre-dimensional (C, Equation 4). Residuals are also given in panel D for IL-7Rα·mAbb·SA488·γc·IL-7b·SA633 after CCF fitting with models accounting for one two-dimensional component (A, Equation 8). Dashed lines indicates half-height cross-correlation function inflection points of single component diffusion. Arrows indicate diffusion times for slow and fast diffusing particles. Six ACF are plotted at increasing ω02 values for IL-7Rα·mAbb·SA488 (panel F) and six CCF for IL-7Rα·mAbb·SA488·γc·IL-7b·SA633 (panel G). Corresponding curves in e and h plotted in panel E acquired at ω02 = 70 × 103 nm2 are shown with arrows. Corresponding τD values extracted from their fitting were used to build diffusion plots (Equation 2) as shown in Figs. 2 and 3.
FIGURE 2.
FIGURE 2.
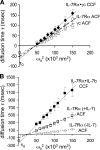
Receptor chain diffusion and assembly at the surface of living CD4 T lymphocytes. A, IL-7-free IL-7Rα, γc, and IL-7Rα·γc diffusion analysis by FCS/FCCS. The following diffusion times τD (in 10−3 s) acquired in the absence of IL-7 are plotted versus the surface area ω2 intercepted by the confocal volume (in 103 nm2) accordingly to Equation 2: IL-7Rα·anti-IL-7Rα·mAbb·SA488 ACF (○), γc·anti-γc·mAbb·SA633 ACF (▵), IL-7Rα·anti-IL-7Rα·mAbb·SA488 with γc·anti-γc·mAbb·SA633 CCF (♦). Slopes of the linear regression give effective diffusion rates Deff and intercepts at the y axis extrapolate confinement times τ0. B, IL-7-bound IL-7Rα, γc, and IL-7Rα·γc diffusion analysis by FCS·FCCS. The following diffusion times τD (in 10−3 s) in the presence of IL-7b·SA633 are plotted versus the surface area ω2 intercepted by the confocal volume (in 103 nm2): ACF of IL-7Rα·anti-IL-7Rα·mAbb·SA488 in the absence of IL-7 (○), ACF of IL-7Rα·anti-IL-7Rα·mAbb·SA488 in the presence of IL-7 (□), CCF of IL-7Rα·anti-IL-7Rα·mAbb·SA488 with IL-7b·SA633 (■). Slopes of the linear regression give Deff and intercepts at the y axis extrapolate τ0. Error bars give S.E.
FIGURE 3.
FIGURE 3.
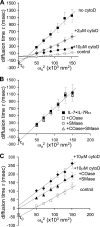
Effect of the cytoskeleton and lipid rafts on IL-7R diffusion. A, IL-7R compartmentalization is released after addition of CytD. The following diffusion times, τD (in 10−3 s), in the presence of IL-7-biotin·streptavidin-A633 are plotted versus the surface area ω2 intercepted by the confocal volume (in 103 nm2): ACF of IL-7Rα·mAbb·SA488 in the absence of IL-7 (○), CCF of IL-7Rα·mAbb·SA488 with IL-7b·SA633 without CytD (■), in the presence of 2 (gray diamond) and 10 μm CytD (♦). Slopes of the linear regression give effective diffusion rates, Deff, and intercepts at the y axis extrapolate confinement time, τ0. B, IL-7R is not affected by the addition of cholesterase oxidase (COase) (1 unit/ml) and sphingomyelinase (Smase) (0.1 unit/ml). The following diffusion times, τD (in 10−3 s), are plotted versus the surface area ω02 intercepted by the confocal volume (in 103 nm2): CCF of IL-7Rα·mAbb·SA488 with IL-7b·SA633 before (■) and after treatment with cholesterase oxidase (1 unit/ml) (□) and sphingomyelinase (0.1 units/ml) (○) or both (▵). C, IL-7R is freed by cholesterase oxidase (1 unit/ml) and sphingomyelinase (0.1 unit/ml) only after CytD treatment. The following diffusion times, τD (in 10−3 s), are plotted versus the surface area ω02 intercepted by the confocal volume (in 103 nm2): ACF of IL-7Rα·mAbb·SA488 in the absence of IL-7 (○), CCF of IL-7Rα·mAbb·SA488 with IL-7b·SA633 in the presence of 10 μm CytD (♦), 10 μm CytD with cholesterase oxidase (1 unit/ml) and sphingomyelinase (0.1 unit/ml) (▴). Slopes of the linear regression give Deff and intercepts at the y axis extrapolate τ0. Error bars give S.E.
FIGURE 4.
FIGURE 4.
IL-7Rα and γc are found in DRM after IL-7 stimulation of CD4 T cells. CD4 T lymphocyte lysates were loaded on a 5–40% sucrose gradient and divided into 18 fractions after 16 h of centrifugation at 50 krpm at 4 °C. Fractions: 1 left, tube top = 5%; 18 right, tube bottom = 40%) were loaded on SDS-PAGE (7% acrylamide-bisacrylamide). Flottilin, IL-7Rα, and γc were located in the membrane fractions by immunoblotting. Fractions corresponding to DRM are indicated above the membrane strip according to flottilin distribution.
FIGURE 5.
FIGURE 5.
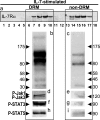
Phosphorylated Jaks and STAT5 are found mainly in DRM after IL-7 stimulation of CD4 T cells. Materials were prepared as described in the legend to Fig. 4. a, after centrifugation, fractions 6 to 10 were pooled to provide a “DRM” sample and fractions 13 to 17 were pooled to form a “solubilized” sample. Both samples were loaded on SDS-PAGE (7% acrylamide-bisacrylamide). Tyr-phosphorylated proteins Tyr(P) (b and c), pJak (d and e), pSTAT3 (f and g), and pSTAT5 (h and i) were revealed by immunoblotting.
FIGURE 6.
FIGURE 6.
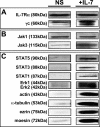
Proteins immunoprecipited with IL-7Rα before and after IL-7 stimulation of CD4 T cells. Proteins were immunoprecipitated with anti-IL-7Rα from CD4 T lymphocyte lysate and separated on SDS-PAGE (7% acrylamide-bisacrylamide). Corresponding bands were cut out of images of specific immunoblots from non-stimulated (NS) and IL-7-stimulated (+IL-7) cells. A, receptor chains; B, “resident” protein selection; C, “IL-7-recruited” protein selection.
FIGURE 7.
FIGURE 7.
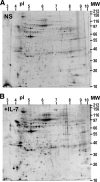
Two-dimensional PAGE analysis of proteins immunoprecipitated with IL-7Rα before and after IL-7 stimulation of CD4 T cells. Proteins were immunoprecipitated with anti-IL-7Rα from CD4 T lymphocyte lysate and separated on two-dimensional PAGE (pH 3–10 and 12% acrylamide-bisacrylamide). Gels were stained with Sypro-Ruby: A, top, non-stimulated cells (NS); B, bottom, IL-7-stimulated cells (IL-7). pH and molecular weight scales are displayed.
FIGURE 8.
FIGURE 8.
Sketch views of the IL-7R-signaling complex assembly upon IL-7 binding. Left (NS conditions), the IL-7-free heterodimer IL-7Rα·γc is embedded in the lipid bilayer out of rafts; Jak1 and Jak3 are constitutively bound to their cognate cytoplasmic receptor chains. Right (+IL-7 conditions), the complex IL-7·IL-7Rα·γc is embedded in the lipid raft. STAT is bound to IL-7Rα·γc·Jak1·Jak3. FERM proteins (E) connect IL-7Rα to F-actin. Integrin chains are linked to F-actin through praxillin (P) or talin (T) complexed to vinculin (V) and Arp2-3 (42). ABP represents actin-binding proteins, S symbolizes proteins inhibiting F-actin elongation, and R represents proteins involved in filament ramification. Tubulin assemblies and proteins unrelated to cytoskeleton are not represented.

Similar articles

Cited by

References

    1. Ma A., Koka R., Burkett P. (2006) Annu. Rev. Immunol. 24, 657–679 - PubMed
    1. Fry T. J., Mackall C. L. (2005) J. Immunol. 174, 6571–6576 - PubMed
    1. Lee S. K., Surh C. D. (2005) Immunol. Rev. 208, 169–180 - PubMed
    1. Palmer M. J., Mahajan V. S., Trajman L. C., Irvine D. J., Lauffenburger D. A., Chen J. (2008) Cell Mol. Immunol. 5, 79–89 - PMC - PubMed
    1. Rochman Y., Spolski R., Leonard W. J. (2009) Nat. Rev. Immunol. 9, 480–490 - PMC - PubMed

Publication types