. 2010 Mar;12(3):221-32.
doi: 10.1093/neuonc/nop026. Epub 2009 Dec 21.

Akt2 and Akt3 play a pivotal role in malignant gliomas

Affiliations

Akt2 and Akt3 play a pivotal role in malignant gliomas

Hideo Mure et al. Neuro Oncol. 2010 Mar.

Abstract

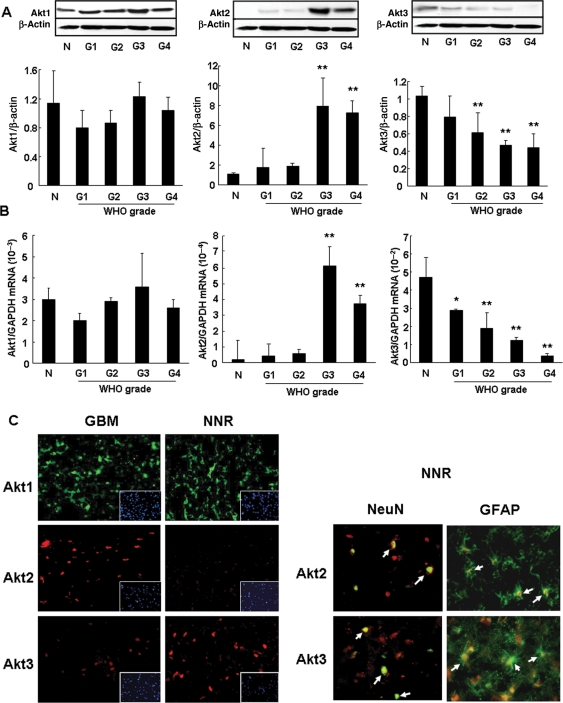
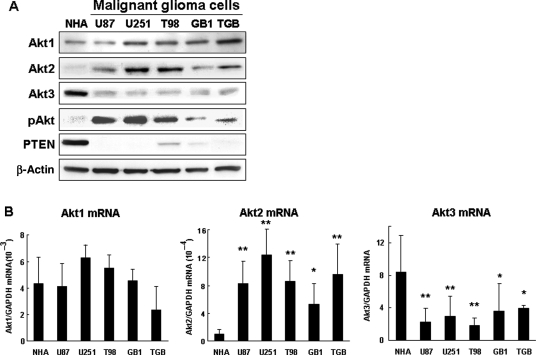
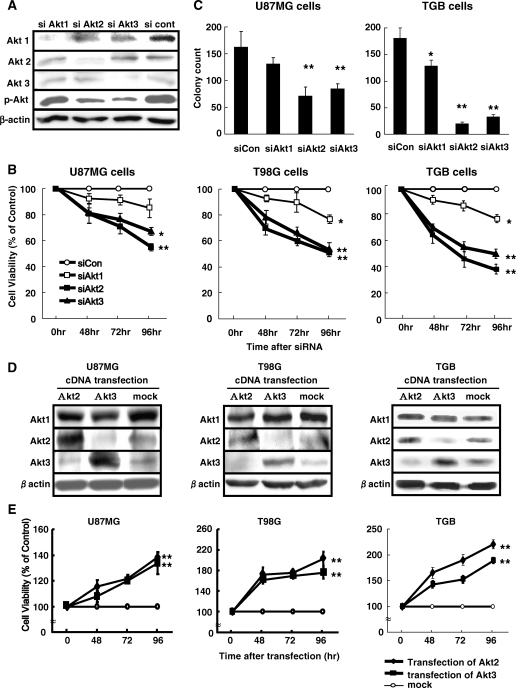
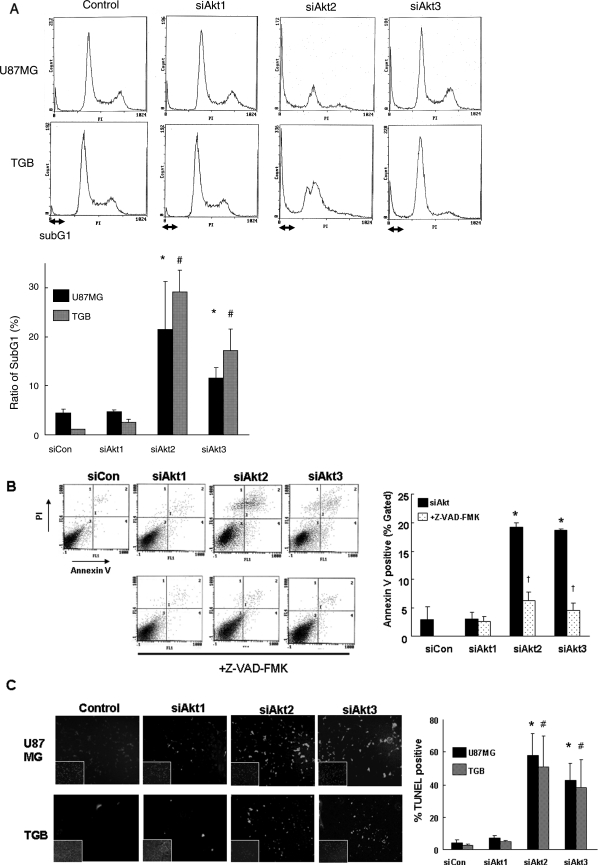
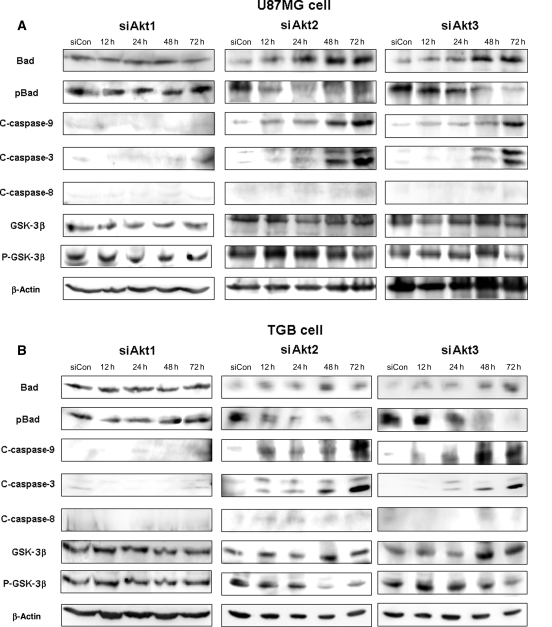
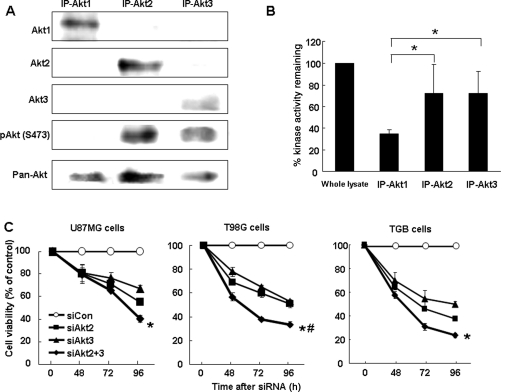
Akt, one of the major downstream effectors of phosphatidylinositol 3-kinase, is hyper-expressed and activated in a variety of cancers including glioblastoma. However, the expression profiles of the Akt isoforms Akt1/PKBalpha, Akt2/PKBbeta, and Akt3/PKBgamma and their functional roles in malignant glioma are not well understood. Therefore, we examined the protein and mRNA expression patterns of Akt isoforms in tissues from human astrocytomas, glioblastomas, and non-neoplastic regions. We also explored the biological role of each Akt isoform in malignant glioma cells using RNA interference-mediated knock-down and the over-expression of plasmid DNA of each isoform. The expression of Akt1 protein and mRNA was similar in glioma and normal control tissues. Although the protein and mRNA level of Akt2 increased with the pathological grade of malignancy, the expression of Akt3 mRNA and protein decreased as the malignancy grade increased. In U87MG, T98G, and TGB cells, the down-regulation of Akt2 or Akt3 by RNA interference reduced the expression of the phosphorylated form of Bad, resulting in the induction of caspase-dependent apoptosis. Akt1 knock-down did not affect cell growth or survival. We first demonstrate that the over-expression of Akt2 or Akt3 down-regulated the expression of the other protein and that endogenous Akt3 protein showed high kinase activity in U87MG cells. Our data suggest that Akt2 and Akt3 play an important role in the viability of human malignant glioma cells. Targeting Akt2 and Akt3 may hold promise for the treatment of patients with gliomas.


Figures

Fig. 1.
Fig. 1.
Protein and mRNA expression of Akt isoforms in malignant glioma tissues. (A) Western blot analysis. The tissue samples were separated into 5 tissue groups, that is, normal tissues (n = 9) or NNR (n = 10) and grade I (n = 4), II (n = 4), III (n = 9), and IV (n = 14) gliomas. The band density of Western blots was quantified using Image-J software. The expression of Akt2 protein was significantly higher in glioma tissues of grades III and IV than grades I and II and the normal control. The Akt3 protein level was low in parallel with the glioma grade. **P < .01, vs normal tissue. (B) mRNA level of Akt isoforms. The mRNA level of Akt isoforms in 6 normal, 14 NNR, 4 grade I, 5 grade II, 10 grade III, and 15 grade IV tissues was determined and normalized with GAPDH mRNA. Akt2 mRNA was remarkably increased in grade III and IV gliomas. Akt3 mRNA decreased with the malignancy grade; it was significantly lower than in normal control tissues. **P < .01, *P < .05 vs normal tissue. (C) Immunohistochemistry of tissues from NNR and areas with GBM. Akt isoform antigen (Akt1, green; Akt2 and Akt3, red) was detected immunohistochemically. The nuclei were counterstained with DAPI (blue). In GBM tissue, the expression of Akt2 protein was high; Akt3 expression was lower. Costaining of NNR tissues with Akt isoforms and NeuN (green) or GFAP (green) showed that Akt2 and Akt3 proteins were expressed in both glial and neural cells (white arrows).
Fig. 2.
Fig. 2.
Protein and mRNA expression of Akt isoforms in glioma cell lines. (A) Representative Western blot analysis of malignant glioma cell lines (U87MG, U251MG, T98G, GB1, and TGB) and NHA. Compared with NHA, the Akt2 protein level was increased while the level of Akt3 protein was decreased in malignant glioma cell lines. (B) The mRNA expression of Akt isoforms in malignant glioma cell lines (U87MG, U251MG, T98G, GB1, and TGB) and NHA. Akt1, Akt2, and Akt3 mRNA expression was normalized with the GAPDH mRNA content. Compared with NHA, the expression of Akt2 mRNA in all cell lines was significantly higher and the expression of Akt3 mRNA was significantly lower. **P < .01, *P < .05 vs NHA.
Fig. 3.
Fig. 3.
Effect of the specific knock-down of Akt isoforms and Akt over-expression on cell growth. (A) Representative Western blots of cells transfected with siRNA. U87MG cells were transfected with siRNA-targeting Akt1 (siAkt1), Akt2 (siAkt2), or Akt3 (siAkt3) and a nontargeting control (siCon). After 72 hours, cell lysates were subjected to Western blot analysis. Akt isoform protein expression was reduced selectively. siAkt2 and siAkt3 produced a greater reduction in the expression of pAkt than siAkt1. (B) Effect of siAkt on cell viability. At 48–96 hours after the introduction of siAkt1, siAkt2, or siAkt3 or a siCon, viable cells were identified with WST-8 reagent. Akt2 or Akt3 knock-down inhibited the growth of U87MG, T98G, and TGB cells. Akt1 knock-down had little effect. *P < .05, **P < .01 vs siCon. (C) Inhibition of colony-forming ability by Akt2 or Akt3 knock-down. U87MG and TGB cells transfected with siAkt or siCon were cultured for 7 days. The efficiency of colony formation was determined. *P < .05, **P < .01 vs siCon. (D) Representative Western blots of malignant glioma cells over-expressing Akt2 or Akt3. U87MG, T98G, and TGB cells were transfected with plasmid encoding Akt2 and Akt3. After 48 hours, cell lysates were analyzed for Akt isoform protein levels. Akt2 and Akt3 were selectively hyper-expressed compared with mock-transfected cells. Akt2 protein was reduced in cells over-expressing Akt3 and Akt3 protein was decreased in cells over-expressing Akt2. (E) Cell growth after the induction of Akt2 or Akt3 protein over-expression. At 48–96 hours post-Akt2 or -Akt3 plasmid transfection, viable cells were identified with WST-8 reagent. The over-expression of Akt2 or Akt3 promoted the growth of U87MG, T98G, and TGB cells compared with mock-transfected cells. **P < .01 vs mock plasmid-transfected cells.
Fig. 4.
Fig. 4.
Induction of apoptosis by Akt2 and Akt3 knock-down. (A) Flow cytometry. At 72 hours after the introduction of siAkt2 or siAkt3 or siCont into U87MG and TGB cells, the cell-cycle profile was analyzed by flow cytometry. All experiments were performed in triplicate. The ratio of subG1 cells was significantly higher in U87MG cells treated with siAkt2 or siAkt3 than those treated with negative control siRNA. *P < .01 vs siControl or siAkt1 in U87MG and #P < .01 vs siControl or siAkt1 in TGB. (B) Annexin V/PI assay. TGB cells were transfected with each Akt isoform, specific siRNA, and negative control, collected 12 hours later, stained with Annexin V/PI, and analyzed by flow cytometry. In siAkt2- or siAkt3-transfected cells, there was a 5-fold increase in the Annexin V positive rate vs the control and siAkt1-treated cells. Z-VAD-FMK and FBS were added 4 hours after transfection. Z-VAD-FMK treatment reversed the effect of siAkt2 or siAkt3 as indicated by Annexin V assay. *P < .01 vs siControl or siAkt1 and P < .01 vs siAkt2 or siAkt3. (C) Representative TUNEL staining. TUNEL positivity was analyzed 72 hours after the introduction of siAkt2, siAkt3, or siCon into U87MG and TGB cells. All experiments were performed in triplicate. The ratio of TUNEL-positive (green) to DAPI-positive (blue) cells was higher in cells treated with siAkt2 or siAkt3 than those treated with negative-control siRNA. *P < .01 vs siControl in U87MG cells and #P < .01 vs siControl in TGB cells.
Fig. 5.
Fig. 5.
Akt2 and Akt3 knock-down activates caspase-9 and -3. Western blots of U87MG cells treated from 12 to 72 hours with siRNA targeting Akt1, Akt2, Akt3, or nontargeting control (siCon). In cells treated with siAkt2 or siAkt3 but not with siAkt1, the pBad was decreased and the level of cleaved caspase-9 and -3 was increased in a time-dependent manner. The expression of cleaved caspase-8 was not affected by siAkt2 or siAkt3.
Fig. 6.
Fig. 6.
Phosphorylation status and kinase activity of Akt isoforms. (A) Akt isoform-specific IP. Lysates from U87MG cells were immunoprecipitated with antibodies against each Akt isoform. Resultant IP were subjected to Western blot analysis with antibodies with the pAkt at serine-473. The pAkt was detected at similar levels in IP-Akt3 and IP-Akt2. The pAkt was not detected in IP-Akt1. (B) Akt kinase activity. IP with antibodies against each Akt isoform were monitored for kinase activity. The kinase activity of Akt3 was equal to that of Akt2. Akt2 and Akt3 kinase activity was much higher than that of Akt1. All experiments were performed in triplicate. *P < .05 vs IP-Akt1. (C) Cell viability after double knock-down of Akt2 and Akt3. At 48–96 hours after the introduction of either siCon, siAkt2, or siAkt3 alone or with siAkt2, and siAkt3 into U87MG, T98G, and TGB cells, cell viability was analyzed. The combination of siAkt2 and siAkt3 enhanced cell death 30%–40% compared with death observed in Akt2 or Akt3 single knock-down cells. *P < .05 vs siAkt3 alone and #P < .05 vs siAkt2 alone.

References

    1. Davis FG, McCarthy BJ. Current epidemiological trends and surveillance issues in brain tumors. Expert Rev Anticancer Ther. 2001;1:395–401. - PubMed
    1. Schwechheimer K, Huang S, Cavenee WK. EGFR gene amplification—rearrangement in human glioblastomas. Int J Cancer. 1995;62:145–148. - PubMed
    1. Omuro AM, Faivre S, Raymond E. Lessons learned in the development of targeted therapy for malignant gliomas. Mol Cancer Ther. 2007;6:1909–1919. - PubMed
    1. Datta SR, Brunet A, Greenberg ME. Cellular survival: a play in three Akts. Genes Dev. 1999;13:2905–2927. - PubMed
    1. Holland EC. Glioblastoma multiforme: the terminator. Proc Natl Acad Sci USA. 2000;97:6242–6244. - PMC - PubMed

Publication types

MeSH terms