Case Reports
. 2010 Mar;12(3):233-42.
doi: 10.1093/neuonc/nop027. Epub 2010 Jan 6.

Tumor invasion after treatment of glioblastoma with bevacizumab: radiographic and pathologic correlation in humans and mice

Affiliations
Case Reports

Tumor invasion after treatment of glioblastoma with bevacizumab: radiographic and pathologic correlation in humans and mice

John F de Groot et al. Neuro Oncol. 2010 Mar.

Abstract

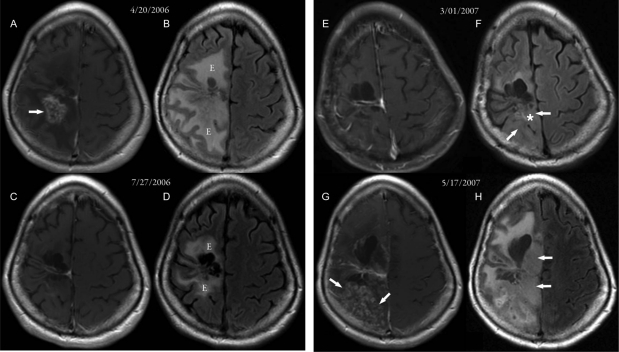
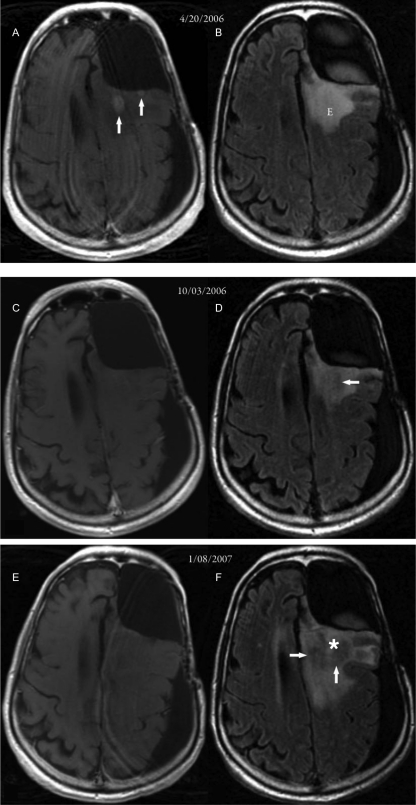
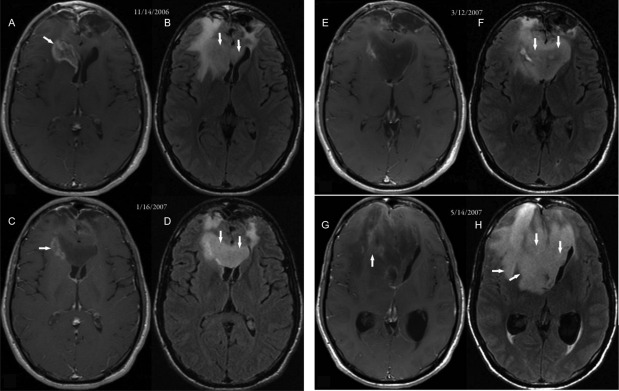
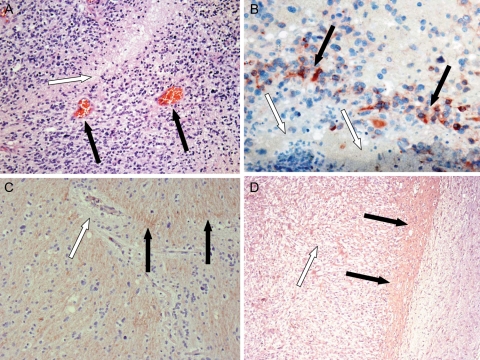
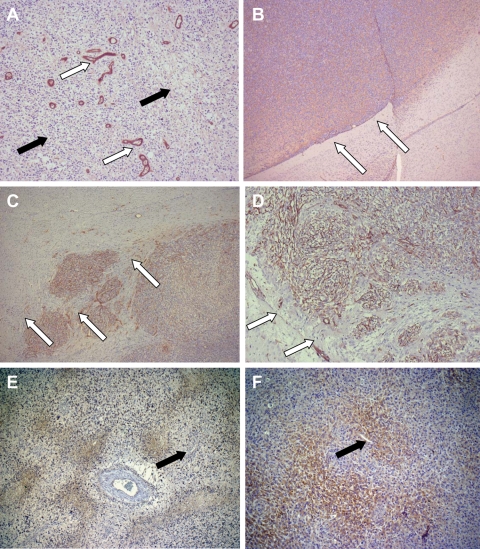
Patients with recurrent malignant glioma treated with bevacizumab, a monoclonal antibody to vascular endothelial growth factor (VEGF), alone or in combination with irinotecan have had impressive reductions in MRI contrast enhancement and vasogenic edema. Responses to this regimen, as defined by a decrease in contrast enhancement, have led to significant improvements in progression-free survival rates but not in overall survival duration. Some patients for whom this treatment regimen fails have an uncharacteristic pattern of tumor progression, which can be observed radiographically as an increase in hyperintensity on T2-weighted or fluid-attenuated inverse recovery (FLAIR) MRI. To date, there have been no reports of paired correlations between radiographic results and histopathologic findings describing the features of this aggressive tumor phenotype. In this study, we correlate such findings for 3 illustrative cases of gliomas that demonstrated an apparent phenotypic shift to a predominantly infiltrative pattern of tumor progression after treatment with bevacizumab. Pathologic examination of abnormal FLAIR areas on MRI revealed infiltrative tumor with areas of thin-walled blood vessels, suggesting vascular "normalization," which was uncharacteristically adjacent to regions of necrosis. High levels of insulin-like growth factor binding protein-2 and matrix metalloprotease-2 expression were seen within the infiltrating tumor. In an attempt to better understand this infiltrative phenotype associated with anti-VEGF therapy, we forced a highly angiogenic, noninvasive orthotopic U87 xenograft tumor to become infiltrative by treating the mice with bevacizumab. This model mimicked many of the histopathologic findings from the human cases and will augment the discovery of alternative or additive therapies to prevent this type of tumor recurrence in clinical practice.


Figures

Fig. 1.
Fig. 1.
MR images from case 1. (A, C, E, and G) Postcontrast axial T1-weighted MR images. (B, D, F, and H) FLAIR MR images. (A and B) Images taken 18 months after 2 surgeries, radiation therapy, and chemotherapy for recurrent glioblastoma. An inhomogeneously enhancing area with necrosis (arrow in A) was seen posterior to the right frontal lobe surgical cavity, with a large area of surrounding edema (“E” in B). (C and D) Images taken 3 months after beginning bevacizumab therapy. The enhancement posterior to the right frontal lobe surgical cavity had disappeared, and there was a significant decrease in the surrounding edema (“E” in D). (E and F) Images taken 8 months after starting bevacizumab therapy. Subtle areas of nonenhancing FLAIR changes (arrows in F) were seen posterior to the surgical cavity, consistent with nonenhancing tumor. (G and H) Images taken approximately 2 months after stopping bevacizumab. Significant progression of nonenhancing tumor (arrows in H) and spotty areas of enhancing tumor (arrows in G) were seen. The approximate biopsy site is indicated by the white asterisk.
Fig. 2.
Fig. 2.
MR images from case 2. (A, C, and E) Axial postcontrast T1-weighted MR images. (B, D, and F) Axial FLAIR MR images. (A and B) Images taken 1 year, 8 months after surgery, radiation therapy, and chemotherapy for an anaplastic mixed oligoastrocytoma in the left frontal lobe. Small enhancing areas (arrows in A) were seen posterior to the left frontal lobe surgical cavity, with surrounding edema (“E” in B). (C and D) Images taken 57 days after beginning bevacizumab therapy. Previously noted enhancing areas had disappeared, and there was a suggestion of nonenhancing tumor (arrow in D). (E and F) Images taken 95 days after starting bevacizumab therapy. An increase in the area of nonenhancing tumor (arrows in F) was evident, with an increase in edema. The approximate biopsy site is indicated by the white asterisk.
Fig. 3.
Fig. 3.
MR images from case 3. (A, C, E, and G) Axial postcontrast T1-weighted MR images. (B, D, F, and H) FLAIR MR images. (A and B) Images taken 14 months after surgery, radiation therapy, and chemotherapy for bifrontal lobe glioblastoma that infiltrated across the genus of the corpus callosum. The enhancing area was seen in the right frontal lobe, capping and infiltrating the right frontal horn (arrow in A). Nonenhancing tumor within the corpus callosum (arrows in B) was better visualized in the FLAIR image. (C and D) Images taken 62 days after beginning bevacizumab therapy. The enhancing area within the right frontal lobe showed significant decrease (arrow in C), but the nonenhancing tumor showed progression (arrows in D). (E and F) Images taken 117 days after beginning bevacizumab therapy. The enhancing area within the right frontal lobe showed further decrease, but the nonenhancing tumor (arrows in F) showed progression. (G and H) Images taken 175 days after initiating bevacizumab treatment. Marked tumor progression was evident by an increase in nonenhancing tumor (arrows in H) and with a small component of enhancing tumor (arrow in G) producing subfalcine herniation. After subtotal resection of the tumor on May 21, 2007, it was histologically proven to be glioblastoma.
Fig. 4.
Fig. 4.
Results of stereotactic biopsy of nonenhancing areas for case 3. (A and B) Human tumor samples from case 3 after progression during bevacizumab treatment. (A) Clearly visible areas of tumor necrosis (white arrow) and single endothelial cell walled vessels (black arrows). ×10 magnification. (B) Noted were areas of necrosis (white arrows), which were adjacent to areas that were positive for immunohistochemical staining for IGFBP2 (black arrows). ×40 magnification. (C and D) Immunohistochemical staining for MMP2 after treatment with bevacizumab. (C) In this specimen from case 3, the vasculature was composed of single endothelial cells (white arrow). Next to these vessels, an increase in expression of MMP2 was seen (black arrows). ×10 magnification. (D) In contrast, in the mouse U87 orthotopic xenograft model, cellular areas that were more dense (white arrow) and the leading edge (black arrows) were seen, which showed prominent staining for MMP2 (black arrows). ×5 magnification.
Fig. 5.
Fig. 5.
Comparison of effects of anti-VEGF treatment between human and animal specimens. (A) In the tissue from case 3, single endothelial cell wall vasculature was clearly highlighted after staining for factor VIII (×5 magnification). (B–D) The U87 orthotopic xenograft model demonstrated striking changes after bevacizumab treatment. (B) Hematoxylin and eosin staining (×2.5 magnification) demonstrated typical (control) growth of U87 cells in the mouse brain, with a sharply defined leading edge of the tumor (white arrows). (C) In contrast, in animals treated with bevacizumab, tumor growth was infiltrative in nature (×2.5 magnification). Factor VIII staining highlighted the robust clusters of vessels in the infiltrating tumor. (D) A higher magnification (×10) of this infiltrating leading edge of the mouse xenograft tumor. Particularly important are the extension and infiltration of tumor cells beyond the dense vasculature (white arrows). The perivascular invasion noted in C and D contrasted with the more infiltrative growth pattern seen in the human tumor samples. CA9 staining in human (E) and U87 xenograft (F) tumor tissue. Prolonged, continuous antiangiogenic treatment significantly increased CA9 staining in tumor. Note the areas of necrosis and hypoxia adjacent to single endothelial cell vasculature (black arrows) and the dilated vessel with surrounding fibrosis.

Similar articles

Cited by

References

    1. Stupp R, Mason WP, van den Bent MJ, et al. Radiotherapy plus concomitant and adjuvant temozolomide for glioblastoma. N Engl J Med. 2005;352:987–996. - PubMed
    1. Wong ET, Hess KR, Gleason MJ, et al. Outcomes and prognostic factors in recurrent glioma patients enrolled onto phase II clinical trials. J Clin Oncol. 1999;17:2572–2578. - PubMed
    1. Curran WJ, Jr, Scott CB, Horton J, et al. Recursive partitioning analysis of prognostic factors in three Radiation Therapy Oncology Group malignant glioma trials. J Natl Cancer Inst. 1993;85:704–710. - PubMed
    1. Millauer B, Shawver LK, Plate KH, Risau W, Ullrich A. Glioblastoma growth inhibited in vivo by a dominant-negative Flk-1 mutant. Nature. 1994;367:576–579. - PubMed
    1. Folkman J. Tumor angiogenesis. Adv Cancer Res. 1985;43:175–203. - PubMed

Publication types

MeSH terms

Substances