Primary cell cultures from human renal cortex and renal-cell carcinoma evidence a differential expression of two spliced isoforms of Annexin A3
- PMID: 20167856
- PMCID: PMC2843458
- DOI: 10.2353/ajpath.2010.090402
Primary cell cultures from human renal cortex and renal-cell carcinoma evidence a differential expression of two spliced isoforms of Annexin A3
Abstract
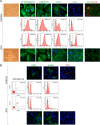
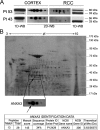
Primary cell cultures from renal cell carcinoma (RCC) and normal renal cortex tissue of 60 patients have been established, with high efficiency (more than 70%) and reproducibility, and extensively characterized. These cultures composed of more than 90% of normal or tumor tubular cells have been instrumental for molecular characterization of Annexin A3 (AnxA3), never extensively studied before in RCC cells although AnxA3 has a prognostic relevance in some cancer and it has been suggested to be involved in the hypoxia-inducible factor-1 pathway. Western blot analysis of 20 matched cortex/RCC culture lysates showed two AnxA3 protein bands of 36 and 33 kDa, and two-dimensional Western blot evidenced several specific protein spots. In RCC cultures the 36-kDa isoform was significantly down-regulated and the 33-kDa isoform up-regulated. Furthermore, the inversion of the quantitative expression pattern of two AnxA3 isoforms in tumor cultures correlate with hypoxia-inducible factor-1alpha expression. The total AnxA3 protein is down-regulated in RCC cultures as confirmed also in tissues by tissue microarray. Two AnxA3 transcripts that differ for alternative splicing of exon III have been also detected. Real-time PCR quantification in 19 matched cortex/RCC cultures confirms the down-regulation of longer isoform in RCC cells. The characteristic expression pattern of AnxA3 in normal and tumor renal cells, documented in our primary cultures, may open new insight in RCC management.
Figures


Similar articles
-
The role of annexin A3 playing in cancers.Clin Transl Oncol. 2013 Feb;15(2):106-10. doi: 10.1007/s12094-012-0928-6. Epub 2012 Aug 22. Clin Transl Oncol. 2013. PMID: 23011854 Review.
-
36-kDa Annexin A3 Isoform Negatively Modulates Lipid Storage in Clear Cell Renal Cell Carcinoma Cells.Am J Pathol. 2020 Nov;190(11):2317-2326. doi: 10.1016/j.ajpath.2020.08.008. Epub 2020 Aug 27. Am J Pathol. 2020. PMID: 32861643
-
Primary cell cultures arising from normal kidney and renal cell carcinoma retain the proteomic profile of corresponding tissues.J Proteome Res. 2005 Sep-Oct;4(5):1503-10. doi: 10.1021/pr050002o. J Proteome Res. 2005. PMID: 16212400
-
Expression and prognostic relevance of annexin A3 in prostate cancer.Eur Urol. 2008 Dec;54(6):1314-23. doi: 10.1016/j.eururo.2008.01.001. Epub 2008 Jan 16. Eur Urol. 2008. PMID: 18222597
-
Annexin A3 and cancer.Oncol Lett. 2021 Dec;22(6):834. doi: 10.3892/ol.2021.13095. Epub 2021 Oct 14. Oncol Lett. 2021. PMID: 34712358 Free PMC article. Review.
Cited by
-
Proteomic Differences in Feline Fibrosarcomas Grown Using Doxorubicin-Sensitive and -Resistant Cell Lines in the Chick Embryo Model.Int J Mol Sci. 2018 Feb 14;19(2):576. doi: 10.3390/ijms19020576. Int J Mol Sci. 2018. PMID: 29443940 Free PMC article.
-
ANXA3 as a novel biomarker for sepsis diagnosis: Evidence from integrative WGCNA analysis.Heliyon. 2024 Sep 30;10(19):e38608. doi: 10.1016/j.heliyon.2024.e38608. eCollection 2024 Oct 15. Heliyon. 2024. PMID: 39430518 Free PMC article.
-
The role of annexin A3 playing in cancers.Clin Transl Oncol. 2013 Feb;15(2):106-10. doi: 10.1007/s12094-012-0928-6. Epub 2012 Aug 22. Clin Transl Oncol. 2013. PMID: 23011854 Review.
-
Targeting glycolysis with 2-deoxy-D-glucose sensitizes primary cell cultures of renal cell carcinoma to tyrosine kinase inhibitors.J Cancer Res Clin Oncol. 2020 Sep;146(9):2255-2265. doi: 10.1007/s00432-020-03278-8. Epub 2020 Jun 12. J Cancer Res Clin Oncol. 2020. PMID: 32533404 Free PMC article.
-
Novel insights into clear cell renal cell carcinoma prognosis by comprehensive characterization of aberrant alternative splicing signature: a study based on large-scale sequencing data.Bioengineered. 2021 Dec;12(1):1091-1110. doi: 10.1080/21655979.2021.1906096. Bioengineered. 2021. PMID: 33783315 Free PMC article.
References
-
- Cohen HT, McGovern FJ. Renal-cell carcinoma. N Engl J Med. 2005;353:2477–2490. - PubMed
-
- Beroukhim R, Brunet JP, Di Napoli A, Mertz KD, Seeley A, Pires MM, Linhart D, Worrell RA, Moch H, Rubin MA, Sellers WR, Meyerson M, Linehan WM, Kaelin JG, Signoretti S. Patterns of gene expression and copy-number alterations in von-Hippel Lindau disease-associated and sporadic clear cell carcinoma of the kidney. Cancer Res. 2009;69:4674–4681. - PMC - PubMed
-
- Kaelin WG., Jr The von Hippel-Lindau tumour suppressor protein: O2 sensing and cancer. Nat Rev Canc. 2008;8:865–873. - PubMed
-
- Anglard P, Trahan E, Liu S, Latif F, Merino MJ, Lerman MI, Zbar B, Linehan WM. Molecular and cellular characterization of human renal cell carcinoma cell lines. Cancer Res. 1992;52:348–356. - PubMed
-
- Perego RA, Bianchi C, Corizzato M, Eroini B, Torsello B, Valsecchi C, Di Fonzio A, Cordani N, Favini P, Ferrero S, Pitto M, Sarto C, Magni F, Rocco F, Mocarelli P. Primary cell cultures arising from normal kidney and renal cell carcinoma retain the proteomic profile of corresponding tissues. J Prot Res. 2005;4:1503–1510. - PubMed
Publication types
MeSH terms
Substances
LinkOut - more resources
Full Text Sources
Other Literature Sources
Medical
Miscellaneous

